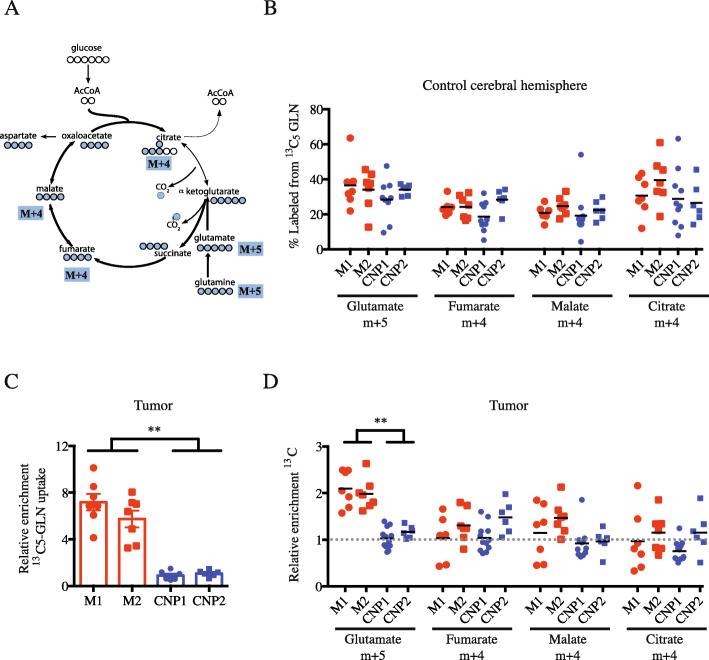
Fig. 4.
Uptake and metabolism of 13C-glutamine in HOT compared to control brain. a Schematic of labeled 13C-glutamine metabolism in the mitochondria. b Relative enrichment in the control cerebral hemisphere from HOT-bearing mice derived from each parental primary culture (CNP1, CNP2, M1, M2; samples from at least 5 independent samples) of labeled glutamate (m + 5), fumarate (m + 4), malate (m + 4), and citrate (m + 4) from 13C-glutamine. c Relative enrichment of 13C-glutamine uptake compared to CTR brain (%) from independent mouse HOT (n > 5) derived from each parental primary culture (M1, M2, CNP1, CNP2). d Relative enrichment compared to CTR brain of labeled glutamate, fumarate, malate, and citrate from 13C-glutamine from independent HOT-bearing mice (n > 5) derived from each parental primary culture (M1, M2, CNP1, CNP2). Two-way ANOVA, *p < 0.05; **p < 0.01

