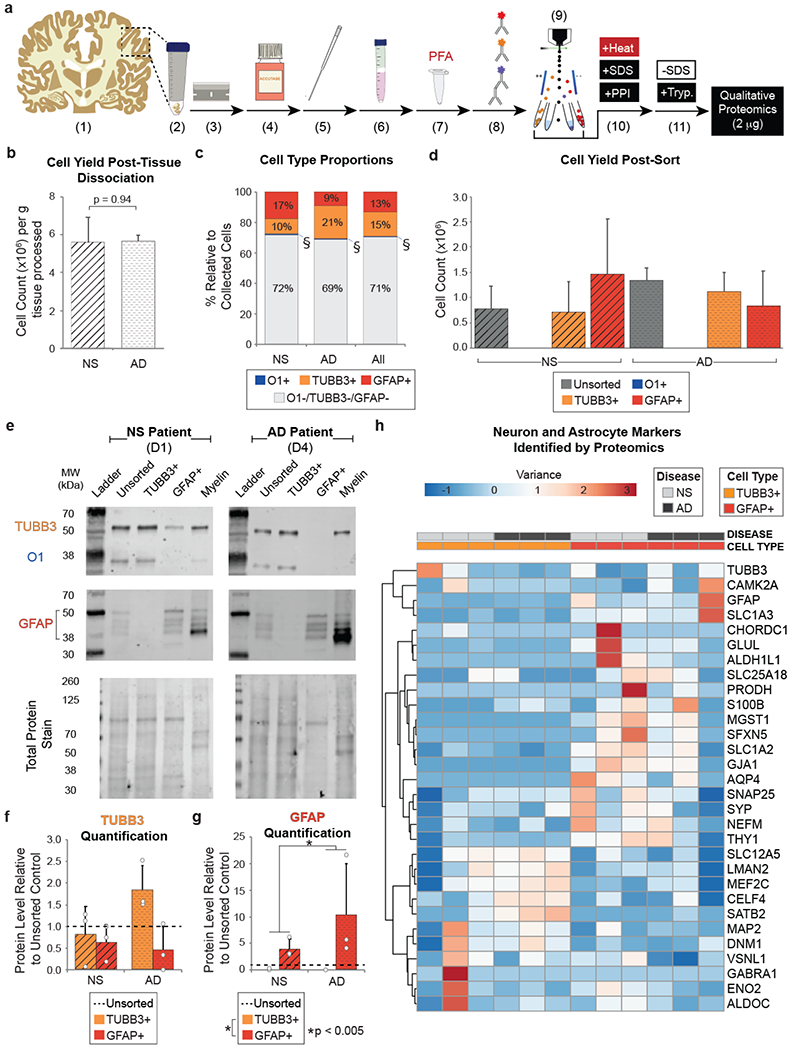
Figure 3. Using FITSAR, protein from neurons and astrocytes could be characterized from human post-mortem AD and age-matched NS brain.

(a) Human sample processing. (1) Frozen tissue (~10 g) was (2) thawed on ice, (3) diced, and dissociated using (4) enzymatic digestion and (5) mechanical trituration. (6) Cells were isolated using a Percoll gradient before (7) being fixed with PFA. (8) Samples were antibody labeled for oligodendrocyte marker 1 (O1), β-III tubulin (TUBB3), and glial fibrillary acidic protein (GFAP) and (9) sorted using fluorescence-activated cell sorting (FACS). (10) Collected TUBB3+ and GFAP+ cells were processed using detergent and high temperature. (11) SDS was removed from protein lysates, and samples were digested using trypsin before analysis by tandem mass spectrometry. (b) Cell yield collected per gram of tissue processed from AD and NS brain. A Student’s t-test was performed to determine significance between disease states (p = 0.94). (c) Average cell type proportions of oligodendrocytes (O1+), neurons (TUBB3+), and astrocytes (GFAP+) relative to the total number of cells analyzed by FACS from AD and NS brain. O1 cell populations (§) made up <1 % of cell total in all donors assessed. A 2-way ANOVA was performed to determine significance among disease states (p = 1), cell types (p < 0.001), and interactions between factors (p = 0.082). (d) Cell type-specific yields post-sort. A 2-way ANOVA was performed to determine significance between disease states (p = 0.72) cell type-specific cell yields (p < 0.01), and interactions between factors (p = 0.29). (e) Example western blots of post-FACS, collected cell populations and myelin debris protein lysates for a NS patient (Donor 1) and an AD patient (Donor 4), assessing TUBB3 (55 kDa), O1 (35 kDa), GFAP (38-50 kDa), and Total Protein Stain. Densitometry-based quantification of (f) TUBB3 and (g) GFAP (50 kDa isoform). 2-way ANOVAs were performed to determine significance between disease states (TUBB3 p = 0.66; GFAP p < 0.005), cell conditions (TUBB3 p = 0.13; GFAP p < 0.005), and interactions between factors (TUBB3 p = 0.40; GFAP p = 0.16). (h) Common neuron and astrocyte markers identified by proteomics supported successful enrichment. Heatmap generated using ClustVis web tool. Abbreviations: D, donor; PPI, protease and phosphatase inhibitor; SDS, sodium dodecyl sulfate; Tryp, trypsin.
