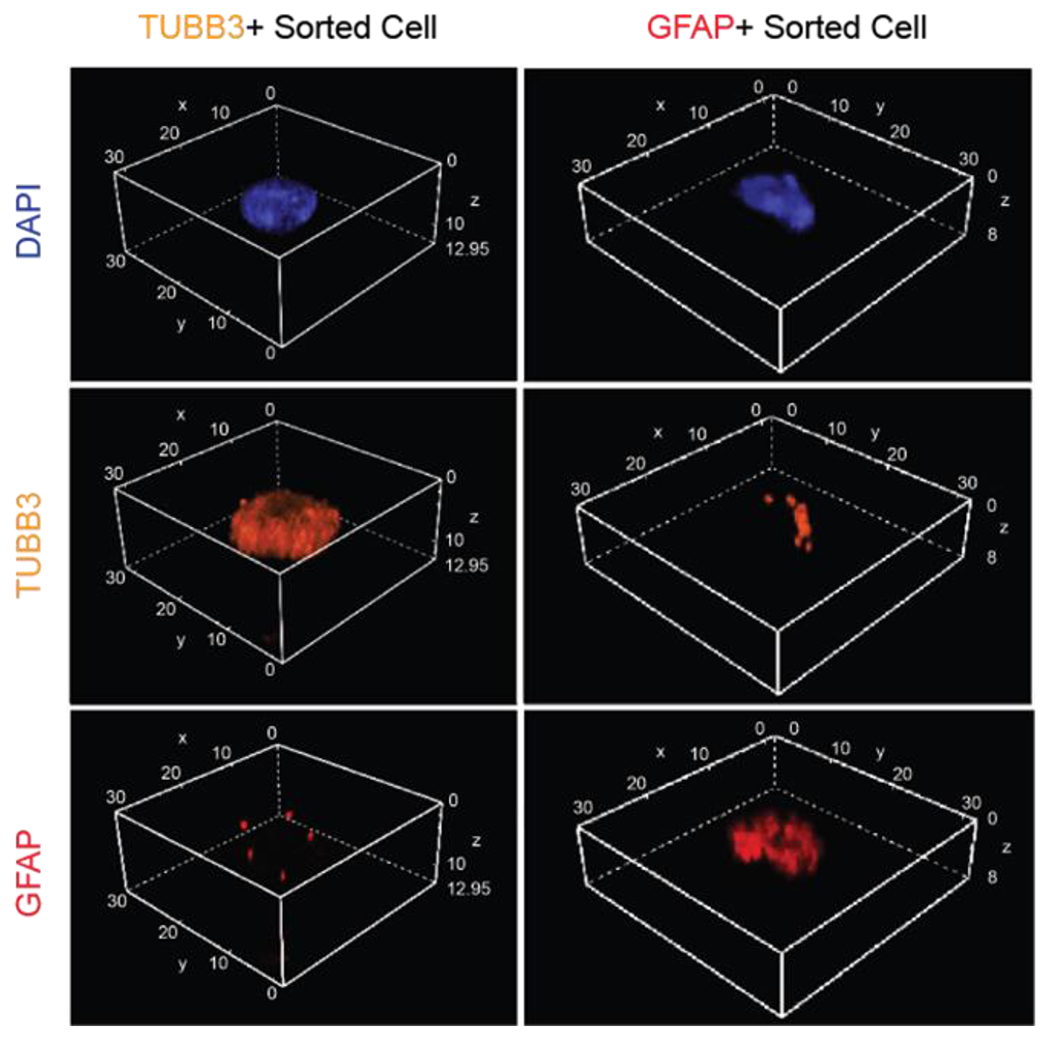
Figure 4. Confocal imaging revealed differences in degree of contamination by neighboring cell processes between sorted TUBB3+ and GFAP+ cells in suspension.

Volumetric stacked images of single, TUBB3+ and GFAP+ sorted cells, respectively. All dimensions listed in μm. Blue, DAPI; Orange, TUBB3; Red, GFAP.
