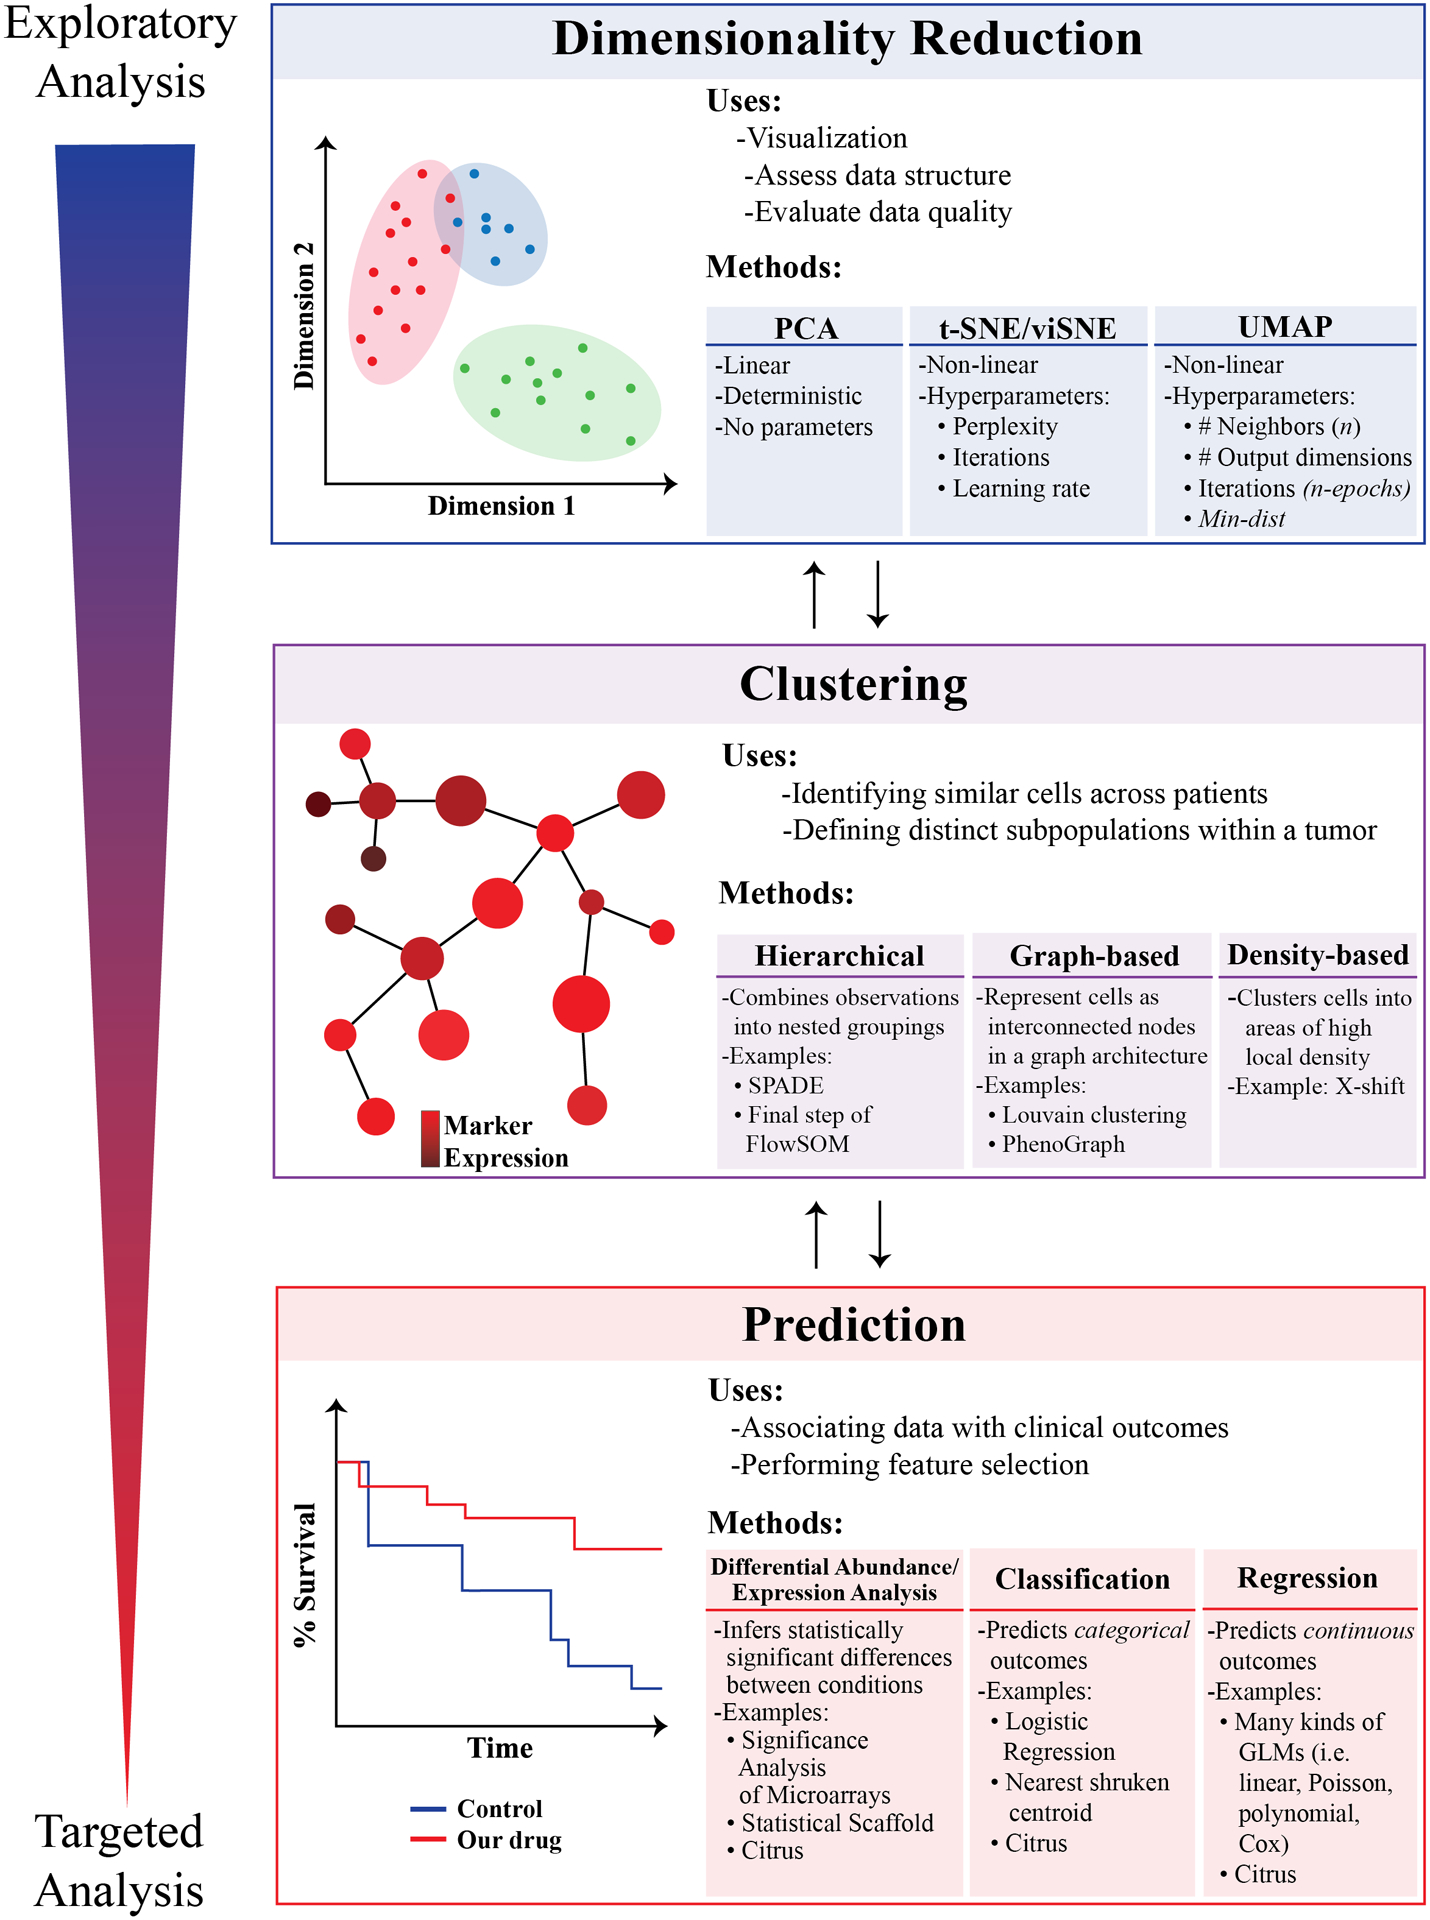
Figure 2 – Schematic diagram representing the analysis strategy described in this review.

We encourage the reader to begin their analyses using exploratory approaches such as dimensionality reduction and basic visualization, later progressing to unsupervised clustering and predictive modeling/correlative biology. Bidirectional arrows are included in the diagram to emphasize that each stage of an analysis will influence multiple other stages, with results from earlier stages often informing the analytic approach in the subsequent stage (and vice versa). Throughout the figure, exploratory analyses are coded as blue, whereas more targeted analyses are coded as red.
