
Figure 2. The Irf8 promoter is hypermethylated in MDSCs.
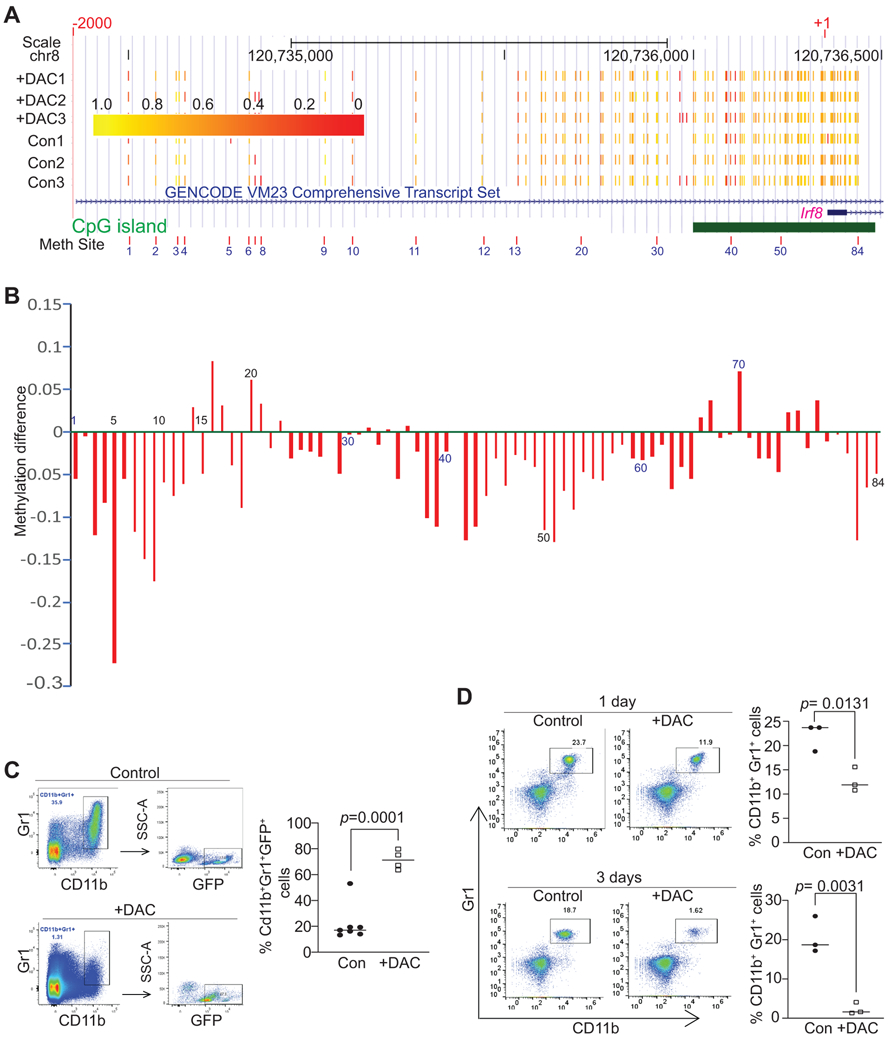
A. CD11b+Gr1+ MDSCs were purified from spleens of control (n=3) and DAC-treated (n=3) AT3 tumor-bearing mice as described in C below. Genomic DNA was purified, bisulfite converted and subjected to the Irf8 promoter (−2000 to +1) targeted bisulfite Sequencing as described in the materials and methods section. Shown is the UCSC genomic browser track of methylation of CpG sites. The number 1-84 correspond to coordinates for each of the detected CpG sites at the Irf8 promoter region. The predicted CpG island is indicated by the green bar. Yellow corresponds to higher methylation levels, while red corresponds to lower methylation levels. B. Methylation difference is calculated by the formula: methylation ratio of the DAC-treated MDSCs (mean of the three samples) – methylation ratio of the control group (mean of the three samples) at the specified site as indicated (#1-84). Methylation ratio was calculated as the measured number of methylated cytosines divided by total number of cytosines covered at that site. The numbers under or above the bar indicate the genomic coordinates as in A. C. AT3 tumor cells (2.5x10⁵ cells/mouse) were injected s.c. to IRF8-GFP reporter mice. The tumor-bearing mice were treated with saline (control, n=7) and DAC (2 mg/kg body weight, n=4) by i.v. injection at days 21 and 23 after tumor cell injection. Mice were sacrificed at day 24. Spleens were collected and stained with CD45.2−, CD11b−, and Gr1-specific mAbs plus DAPI. The live CD45.2+ cells were dated and analyzed for CD11b+Gr1+ cells. The CD11b+Gr1+ cells were then gated for GFP+ cells. The % GFP+ cells were quantified and presented at the right. D. IRF8 KO mice were treated with saline (control, n=3) and DAC (2 mg/kg body weight, n=3) by i.v. injection once every 2 days for 2 times. Blood samples were collected from the mice at day 1 and 3 after the 1st DAC treatment. White blood cells were processed and stained with CD11b−, and Gr1-specific mAbs. Left panel shows dot plots of the CD11b+Gr1+ cells, and right panel shows quantification of CD11b+Gr1+ cells.