
Figure 5. The promoter DNA of Tnf, Ripk1 and Ripk3 are methylated in tumor-induced MDSCs in vivo.
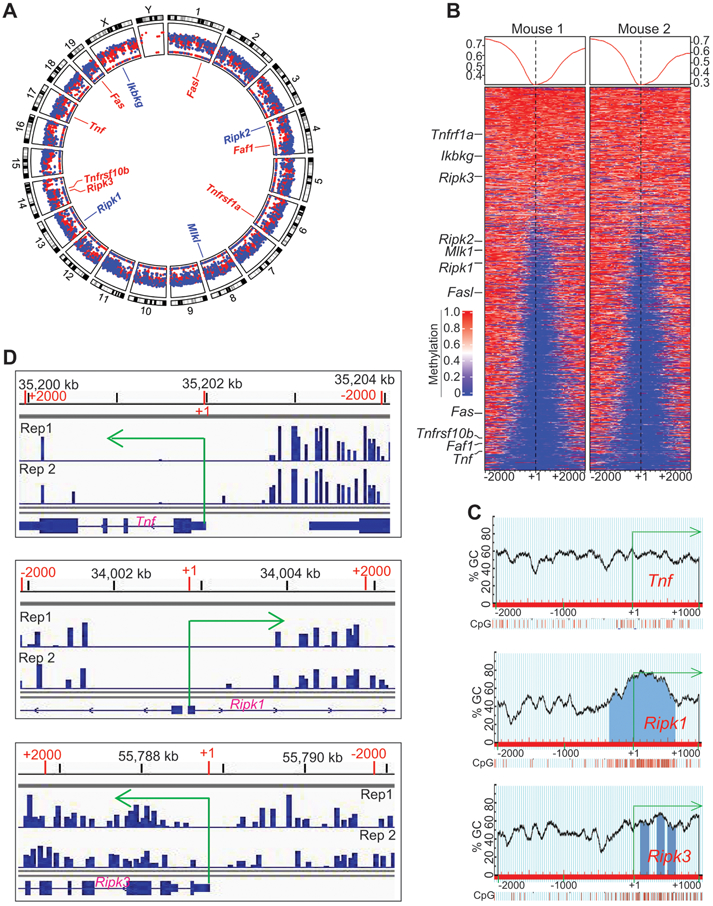
A. Spleens were collected from AT3 tumor-bearing mice as in Fig. 1A. The genomic DNA from purified CD11b+Gr1+ cells were then analyzed by bisulfite conversion and Illumina NGS sequencing. The sequencing data were transformed to raw reads, and the raw reads were further analyzed by Bismark program to align bisulfite-treated reads to reference genome. The gene annotation files and methylation level were then determined. Shown is the Circos plot of the genome-wide distribution of hyper and hypomethylated regions in the tumor-induced MDSC genome by chromosome. The mean methylation levels within a 2000 bp windows starting TSS to +2000 bp upstream are displayed. The promoters with methylation levels >= 0.33 are displayed in red and those < 0.3 are displayed in blue. Several genes with known functions in cell death pathways are highlighted in the inner circle. Shown is one of the two representative experiments. B. Promoter-specific heatmap of methylation at DMR loci identified in the MDSCs from two tumor-bearing mice. The methylation signals within the ±2000 of TSS was calculated using 50 bp windows and plotted in a heatmap. The color gradient indicates with methylation from 0 to 1, corresponding to 0% to 100% methylation. Several genes with known functions in cell death pathways are indicated at the left. C. The Tnf, Ripk1, and Ripk3 promoter DNA sequences (−2000 to +1000 relative to the transcription start site) were extracted from the mouse genome database using ensemble genome browser. The DNA sequences were uploaded to the MethPrimer for predication CpG islands. Shown are the predicted CpG islands and CpG content of their indicated gene promoters. D. CD11b+Gr1+ cells were purified from spleens of AT3 tumor-bearing mice using the CD11b microbeads and LS columns (Miltenyi Biotech). Genomic DNA was prepared from the purified cells and subjected to bisulfite-sequencing. The methylation reads were loaded to IGV genome browser. Shown is snapshots of the DNA methylation profiles at the TNf, Ripk1, and Ripk3 promoter regions.