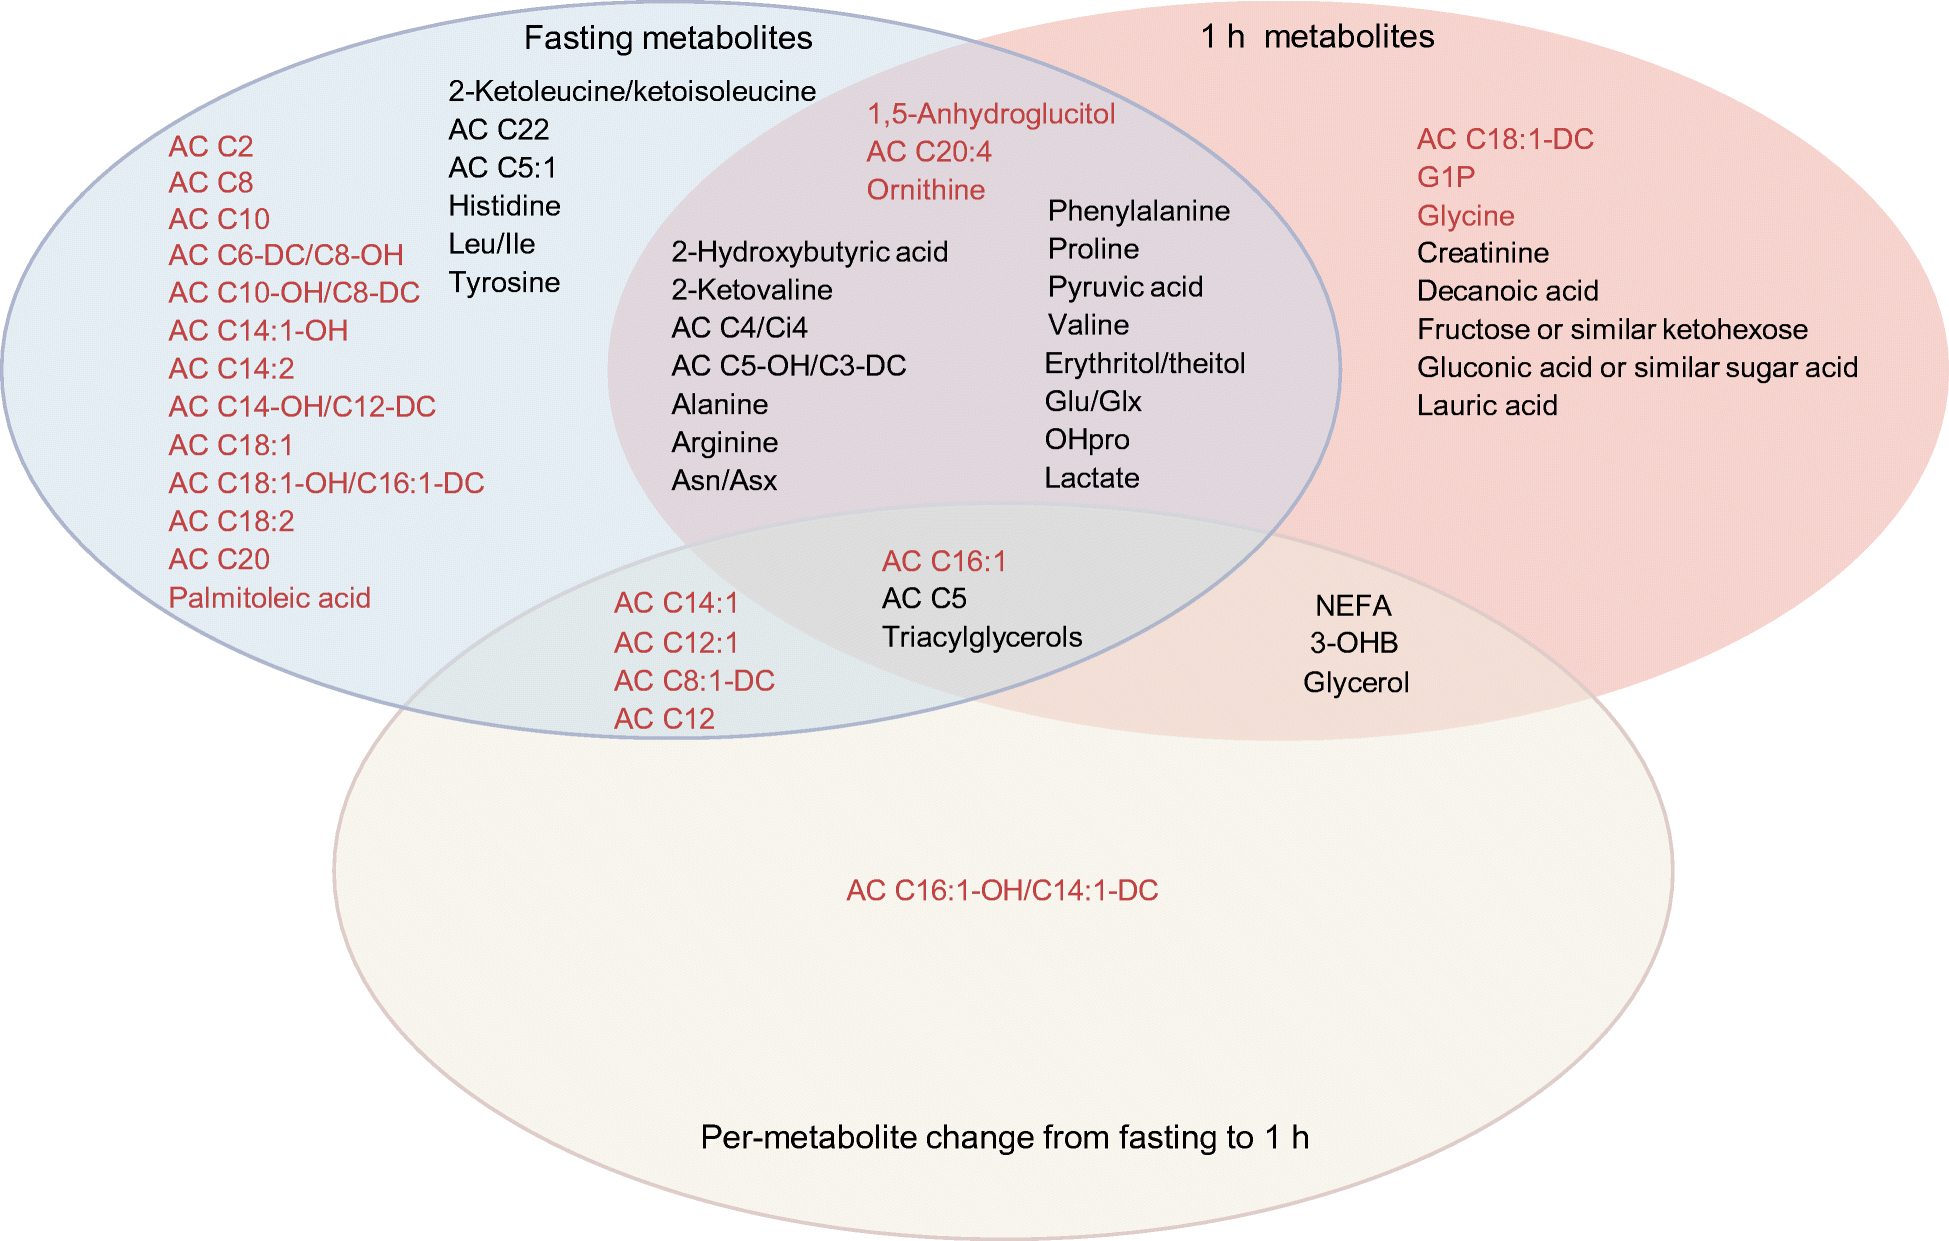
Fig. 1.

Significant associations of fasting and 1 h metabolite levels and per-metabolite change following a glucose load with insulin sensitivity in meta-analysis. Significant associations of metabolites are shown based on p<0.05 after FDR adjustment in the fully adjusted model (model 4), which included field centre, sample storage time, mean arterial pressure, maternal age, neonatal sex, gestational age and maternal BMI at OGTT and parity. The red metabolites were positively associated with insulin sensitivity and the black metabolites were inversely associated. AA, amino acid; AC, acylcarnitine; Asn/Asx, asparagine/aspartic acid; Cho, carbohydrate; FA, fatty acid; G1P, glycerol 1-phosphate; GC/TCA, glycolysis/tricarboxylic acid cycle; Glu/Glx, glutamine/glutamic acid; Leu/Ile, leucine/isoleucine; NM/2AA/NE, N-methylamine/2-aminobutanoic acid/N-ethylglycine; OA, organic acid; OHpro, hydroxyproline; Pur/Pyr, purine or pyrimidine
