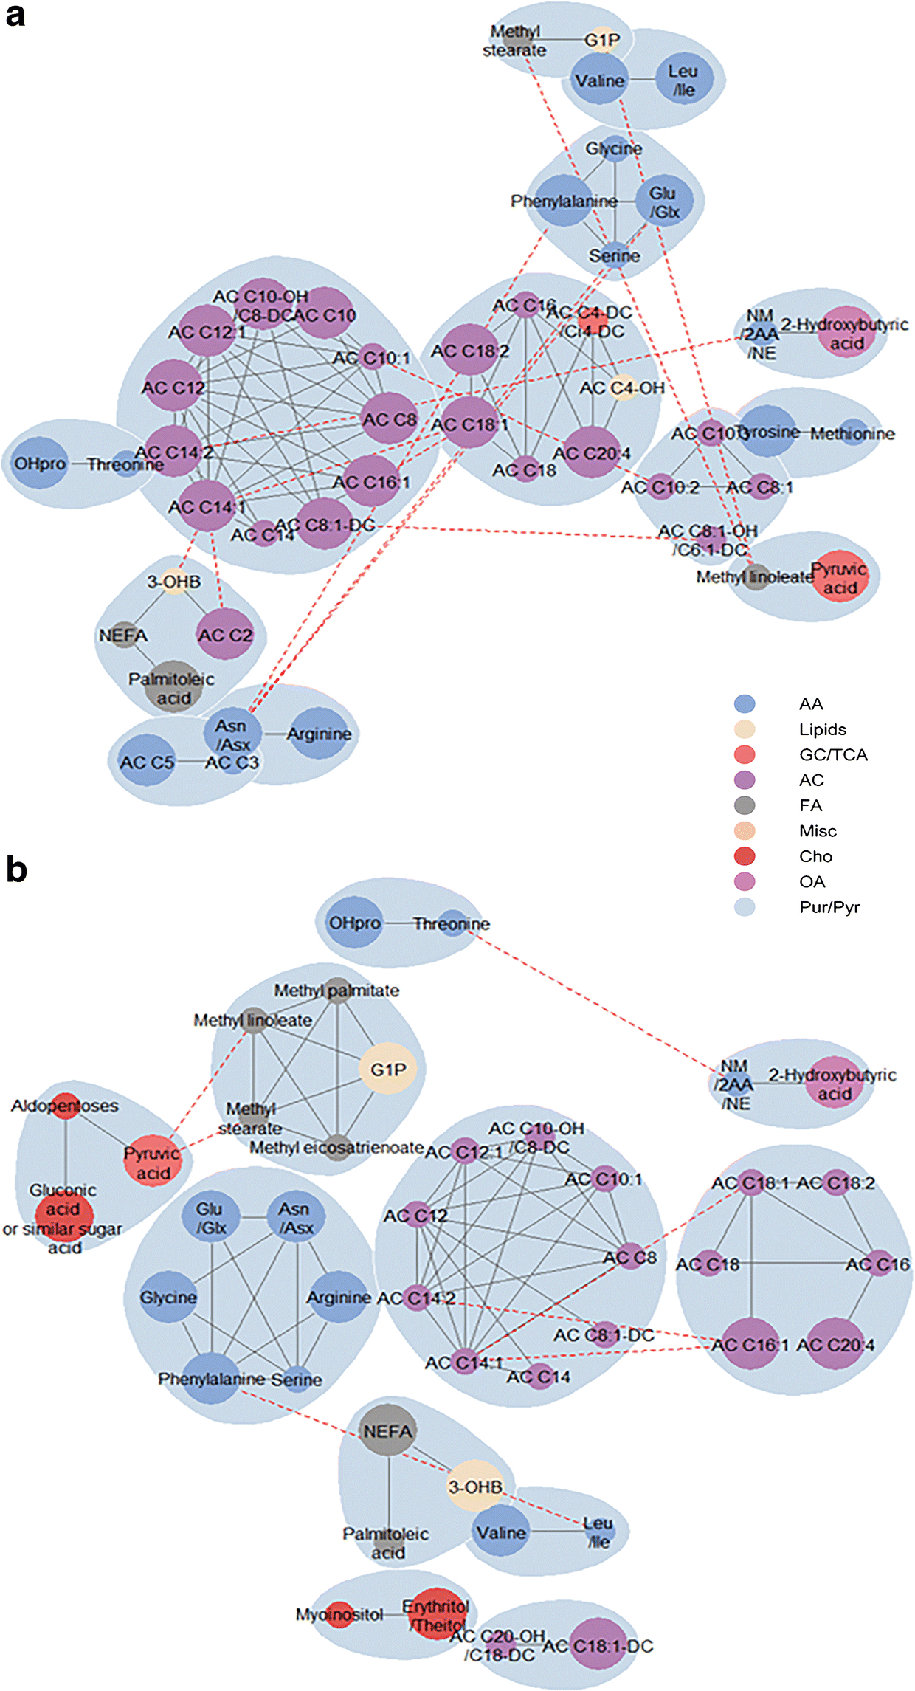
Fig. 2.

Sub-networks of fasting metabolites (a) and 1 h metabolites (b) associated with maternal insulin sensitivity. Nodes are coloured by metabolite class and sized by FDR-adjusted p values in the fully adjusted model (model 4), with large nodes referring to metabolites significantly associated with insulin sensitivity and small nodes referring to metabolites correlated with an individually significant metabolite. Blue shading represents spinglass communities within the estimated network. The solid lines between two nodes represent dependencies for intra-cluster metabolites, and the red dashed lines represent dependencies for metabolites across clusters. AA, amino acid; AC, acylcarnitine; Asn/Asx, asparagine/aspartic acid; Cho, carbohydrate; FA, fatty acid; G1P, glycerol 1-phosphate; Glu/Glx, glutamine/glutamic acid; Leu/Ile, leucine/isoleucine; NM/2AA/NE, N-methylamine/2-aminobutanoic acid/N-ethylglycine; OA, organic acid; OHpro, hydroxyproline; Pur/Pyr, purine or pyrimidine
