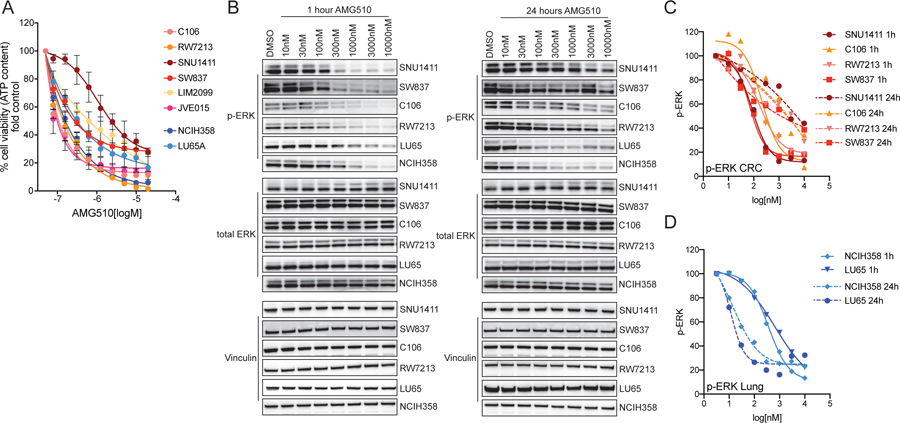
Figure 1: Response to KRAS G12C inhibition in CRC cell lines.

(A) Short term proliferation assay of CRC cell lines (shades of red) and NSCLC cell lines (shades of blue). Cells were treated for 120 hours with increasing concentration of AMG510 and then ATP content was measured using CellTiterGlo. Data represents the average and standard deviation of 3 biological replicates. (B) Western blot analysis of ERK activation upon AMG510 dose-response treatment after 1 hour and 24 hours treatment. Vinculin is used as loading control. (C) Densitometry analysis of CRC cell lines in western blot in (B). p-ERK values are normalized on both total ERK and Vinculin and on DMSO control. (D) Densitometry analysis of NSCLC cell lines western blot in (B). p-ERK values are normalized on both total ERK and Vinculin and on DMSO control.
