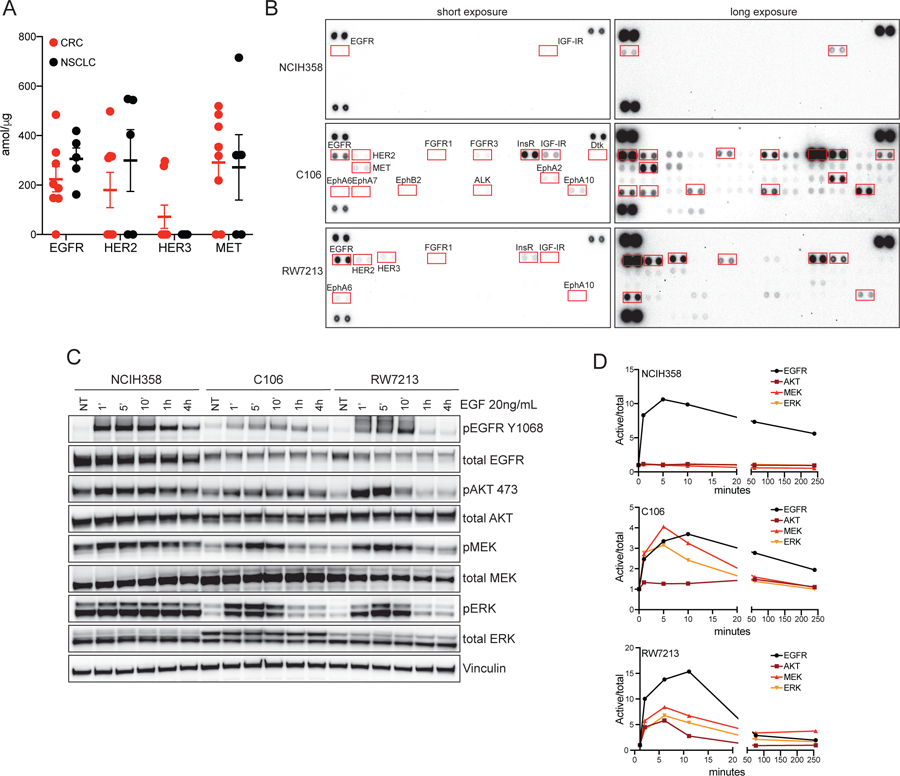
Figure 2: RTK component and responsiveness in CRC cell lines.

(A) Mass spectrometry analysis of RTK in CRC and NSCLC patients-derived biopsies. (B) Phospho-RTK array of NCIH358 (NSCLC), C106 and RW7213 (CRC) cell lines. Cell were FBS starved for 24h and stimulated with 20% FBS for ten minutes before harvesting. (C) Western blot analysis of KRAS downstream effectors in NCIH358 (NSCLC), C106 and RW7213 (CRC) cell lines upon time course EGF treatment. Vinculin is used as loading control. (D) Densitometry analysis of p-AKT, p-MEK and p-ERK of western blot in (C). Phospho-proteins values are normalized on total proteins and Vinculin and on not treated (NT) control.
