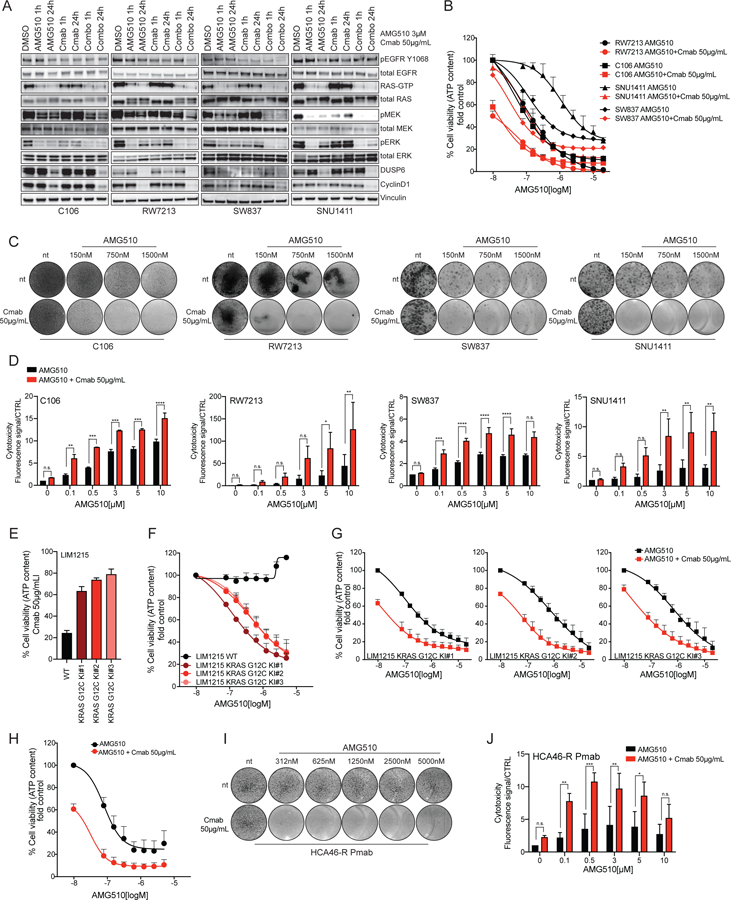
Figure 3: EGFR inhibition sensitizes CRC cell lines to AMG510.

(A) Western blot analysis of cetuximab plus AMG510 combinatorial treatment in time course in C106, RW7213, SNU1411 and SW837 CRC cell lines. RAS-GTP pull down assay is included, and Vinculin is used as loading control. (B) Short-term proliferation assay of C106, RW7213, SNU1411 and SW837 treated with increasing concentration of AMG510 with or without 50ug/mL cetuximab. First data points of the combination curves represent the response to cetuximab alone. Cells were treated for 120 hours with increasing concentration of AMG510 and then ATP content was measured using CellTiterGlo. Data represents the average and standard deviation of 3 biological replicates. The AMG510 single agent curves used in this graph, are the same used in fig 1A. (C) Long-term drug screening proliferation assay of C106, RW7213, SNU1411 and SW837 treated with increasing concentration of AMG510 with or without 50μg/mL cetuximab. Cetuximab only treated cells are shown in the first lower circles. Cells were treated for 9 to 13 days according to the time when untreated controls reached confluence. (D) CellTox assay of C106, RW7213, SNU1411 and SW837 treated with increasing concentration of AMG510 with or without 50μg/mL cetuximab. Cetuximab only treated cells are shown as the first red bar at 0μM AMG510. Cells were treated for 120 hours. Data represents the average and standard deviation of 3 biological replicates. Statistical significance was calculated using one-way ANOVA with Bonferroni’s correction. Asterisks indicates *=p<0.05, **=p<0.01, ***=p<0.001, ****=p<0.0001, n.s.= not significant. (E) LIM1215 KRAS G12C Knock-In (KI) clones response to cetuximab; LIM1215 parental cells were included as control. (F) LIM1215 KRAS G12C KI clones response to AMG510 in short-term proliferation assay. Cells were treated for 120 hours with increasing concentration of AMG510 and then ATP content was measured using CellTiterGlo. Data represents the average and standard deviation of 3 biological replicates. (G) LIM1215 KRAS G12C KI clones response to AMG510+cetuximab in short-term proliferation assay. First data points of the combination curves represent the response to cetuximab alone. Cells were treated for 120 hours with increasing concentration of AMG510 and then ATP content was measured using CellTiterGlo. Data represents the average and standard deviation of 3 biological replicates. (H) HCA46-R Pmab cell line response to AMG510+cetuximab in short-term proliferation assay. First data point of the combination curve represents the response to cetuximab alone. Cells were treated for 120 hours with increasing concentration of AMG510 and then ATP content was measured using CellTiterGlo. Data represents the average and standard deviation of 3 biological replicates. (I) Long-term drug screening proliferation assay of HCA46-R Panitumumab treated with increasing concentration of AMG510 with or without 50ug/mL cetuximab. Cetuximab only treated cells are shown in the first lower circles. (J) CellTox assay of HCA46-R Pmab treated with increasing concentration of AMG510 with or without 50ug/mL cetuximab. Cetuximab only treated cells are shown as the first red bar at 0μM AMG510. Data represents the average and standard deviation of 3 biological replicates. Statistical significance was calculated using one-way ANOVA with Bonferroni’s correction. Asterisks indicates *=p<0.05, **=p<0.01, ***=p<0.001, ****=p<0.0001, n.s.= not significant.
