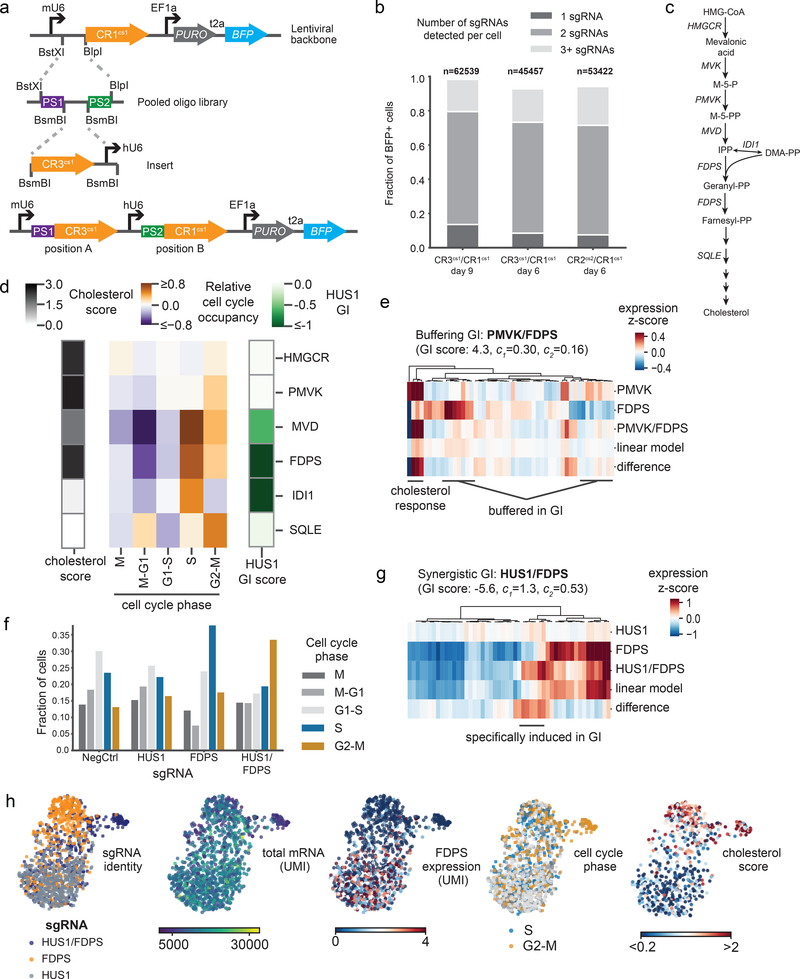
Figure 2: Direct capture Perturb-seq and pooled dual-guide cloning allows systematic dissection of genetic interactions between cholesterol biosynthesis and DNA repair genes.
a) Schematic of programmed dual-guide library cloning strategy. Paired sgRNA targeting regions are synthesized on a single oligo and cloned into a direct capture Perturb-seq vector by ligation. Then, an sgRNA constant region and hU6 promoter are inserted between the sgRNA targeting regions to generate a dual-guide array in a lentiviral backbone. This example shows a CR3cs1/CR1cs1 library design. b) Guide assignment rates for dual-guide direct capture Perturb-seq experiments. The fraction of cells carrying sgRNAs (marked by BFP) varied due to strong CRISPRi growth defects; the total number of cells were therefore first scaled by BFP positivity. The total number of cells and fraction of cells assigned a single guide, two guides, or more than two guides are indicated. c) Schematic of the cholesterol biosynthesis pathway. d) Heatmap of cell cycle and cholesterol phenotypes for cells with depletion of enzymes in the cholesterol biosynthesis pathway. Cell cycle occupancy for each perturbation depicted indicates the relative enrichment or depletion of cells in each phase relative to unperturbed cells. The cholesterol score is the mean z-scored expression of enzymes in the cholesterol biosynthesis pathway. The “HUS1 GI” is a metric of the growth defect caused by an genetic perturbations paired with HUS1 knockdown relative to the genetic perturbation alone as determined by Horlbeck et al.28 All genes were significantly depleted by CRISPRi (percent knockdown: HMGCR 94%; PMVK 92%; MVD 83%; FDPS 78%; IDI1 82%; SQLE 84%). Number of cells per perturbation: non-targeting control n=527, HMGCR n=608, PMVK n=389, MVD n=184, FDPS n=439, IDI1 n=131, SQLE n=255. e) Heatmap of gene expression for the 50 most differentially expressed genes between cells carrying each indicated perturbation. Expression values are the z-scored expression relative to unperturbed cells (n=389 PMVK cells, n=1921 FDPS cells, and n=517 PMVK/FDPS cells). Cells were combined to generate the expression signatures. Knockdown was consistent between single-gene and dual-gene targeting (FDPS knockdown 73% alone vs. 82% paired; PMVK knockdown 92% alone vs. 86% paired). The indicated GI score was previously determined by Horlbeck et al.28, where GI scores >3 are considered strongly buffering interactions. f) Fraction of cells in each cell cycle phase across cells with the indicated perturbations. Number of cells per perturbation: non-targeting control n=780, HUS1 n=905, FDPS n=439, HUS1/FDPS n=831. g) Heatmap of gene expression for the 50 most differentially expressed genes between cells carrying each indicated perturbation. Expression values are the z-scored expression relative to unperturbed cells (n=905 HUS1 cells, n=439 FDPS cells, and n=831 HUS1/FDPS cells). Cells were combined to generate the expression signatures. Knockdown was consistent between single-gene and dual-gene targeting (FDPS knockdown 78% alone vs. 72% paired; HUS1 knockdown 95% alone vs. 85% paired) The indicated GI score was previously determined by Horlbeck et al.28, where GI scores <−3 are considered strongly synergistic interactions. h) Single-cell UMAP projections with informative cell features highlighted (n=2175 cells).

