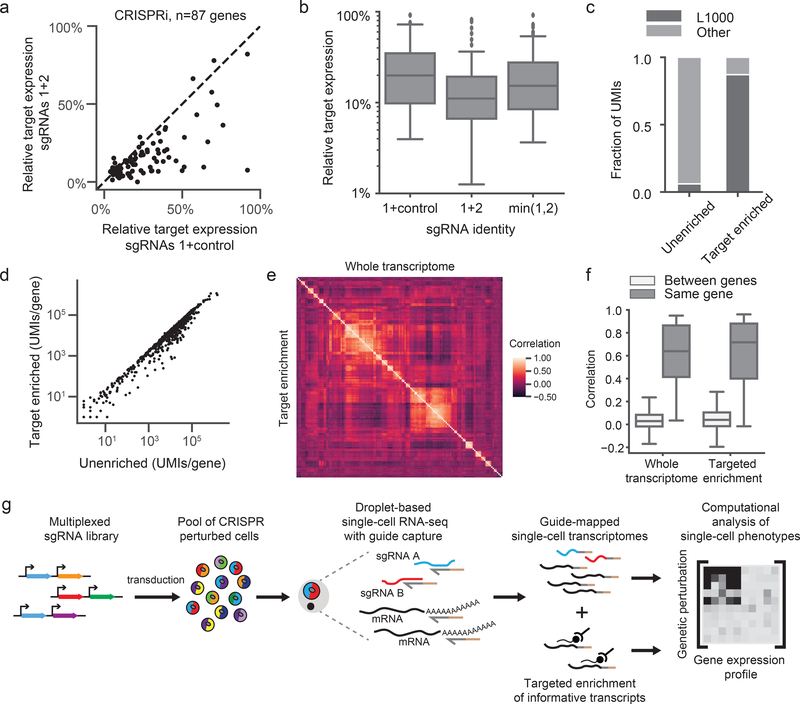
Figure 3: Multiplexed CRISPRi/CRISPRa and hybridization-based target enrichment enable scalable and versatile single-cell CRISPR screens.
a) Scatterplot of the relative target expression per gene comparing CRISPRi knockdown with a single sgRNA (expressed from a dual-guide vector paired with a non-targeting control) versus multiplexed sgRNAs. Multiplexed sgRNAs significantly improve knockdown (sgRNAs 1+control median relative target expression=0.20; sgRNAs 1+2 median relative target expression=0.11; Wilcoxon signed-rank two-sided test n=87 genes, W=378, p=8e-11). sgRNA 1, best predicted sgRNA for each gene. sgRNA 2, second best predicted sgRNA for each gene. b) Box plots of the relative target expression per gene in the multiplexed CRISPRi experiment denoting quartile ranges (box), median (center mark), and 1.5 × interquartile range (whiskers). “min(1,2)” indicates the minimum remaining target expression between sgRNA 1 (paired with negative control) and sgRNA 2 (paired with negative control), ie. the predicted multiplexed sgRNA knockdown based on a dominant model of knockdown. The multiplexed sgRNAs performed better than the dominant model (Wilcoxon signed-rank two-sided test n=87 genes, W=698, p=3e-7). c) The fraction of total UMIs for L1000 genes (n=978) versus other genes, before and after target enrichment. d) Scatterplot of the total number of UMIs for each gene, before and after target enrichment (n=978 genes). The Pearson correlation of log10 normalized UMIs is r=0.98. e) Heatmap depicts clustering of guides in our multiplexed CRISPRi experiment. Heatmap represents Spearman’s rank correlations between pseudo-bulk expression profiles of well-expressed genes (>1 UMI/cell). Data from all perturbations with >10 differentially expressed genes compared to controls are included (n=145 genes). The upper triangle (correlation matrix) was calculated on the whole transcriptome while the lower triangle (correlation matrix) was calculated on the target-enriched transcriptome. Both triangles were identically ordered based on hierarchical clustering of the whole transcriptome correlation matrix. f) Pearson correlations of pseudo-bulk differential expression profiles of well-expressed genes (>1 UMI/cell) caused by sgRNAs targeting the same gene (for n=39 genes whose knockdown led to differential gene expression) versus sgRNAs targeting different genes (n=111592 pairs). sgRNAs targeting the same gene had significantly more similar profiles than sgRNAs targeting different genes, both before and after target enrichment (unenriched median r=0.64, Mann-Whitney U two-sided test U=117224, p=1.4e-24; enriched median r=0.72, Mann-Whitney U two-sided test U=259898, p=1.7e-21). Box plots denote quartile ranges (box), median (center mark), and 1.5 × interquartile range (whiskers). g) Schematic overview of direct capture Perturb-seq workflow.

