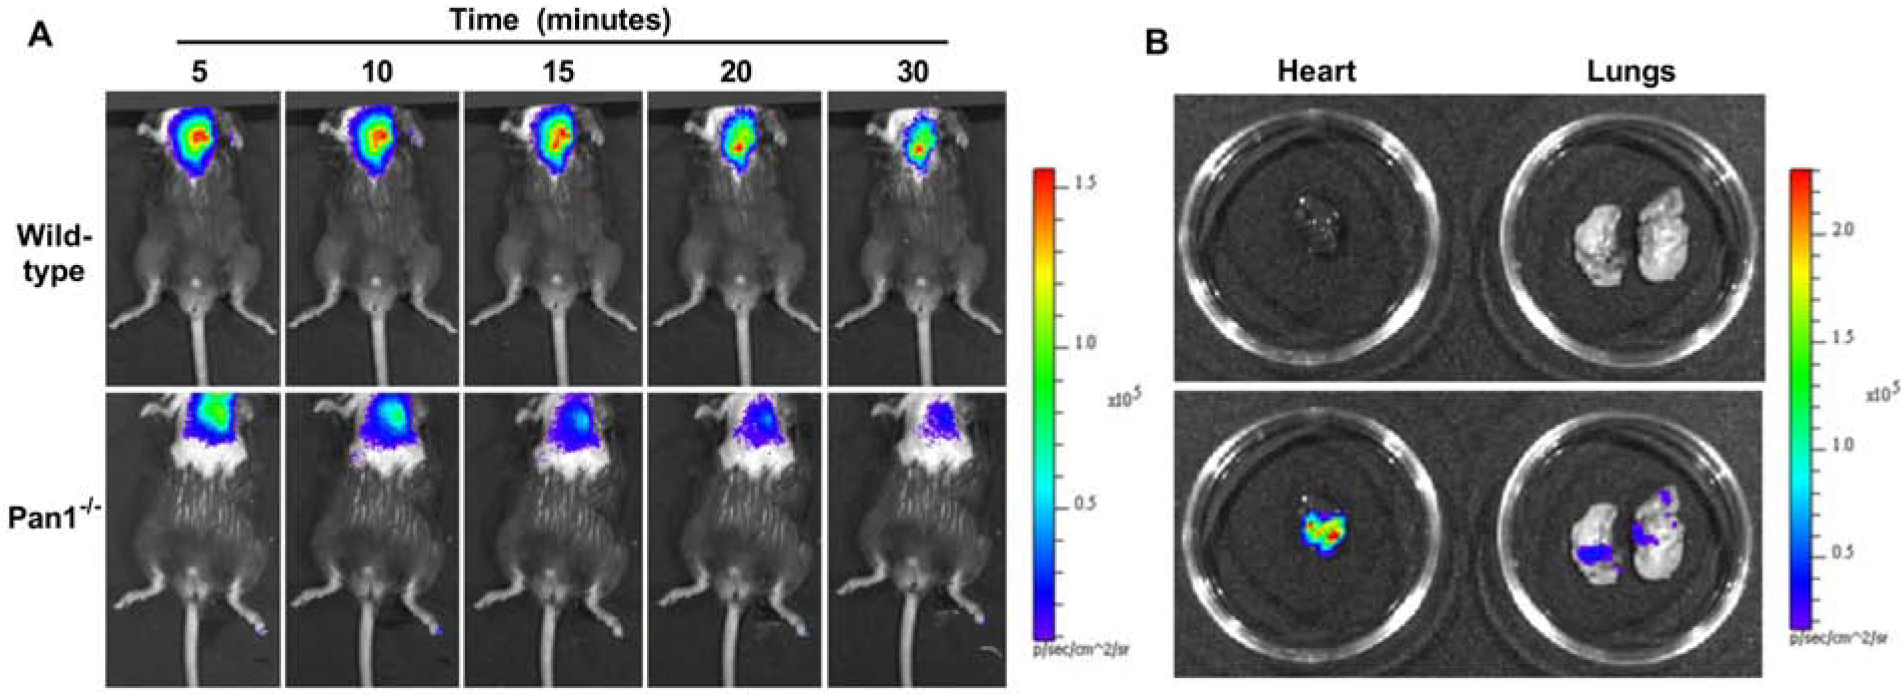
Figure 4. (A).

Examples of in vivo optical imaging of ATP production using a luciferin-luciferase assay in anesthetized wild-type and Panx1−/− mice at increasing time intervals after MB cavitation. (B) Examples of ex vivo imaging using bright light without (top) and with (bottom) superimposed luminescence imaging for the lung and heart from a wild-type mouse undergoing myocardial MB cavitation. Scales are shown to the right.
