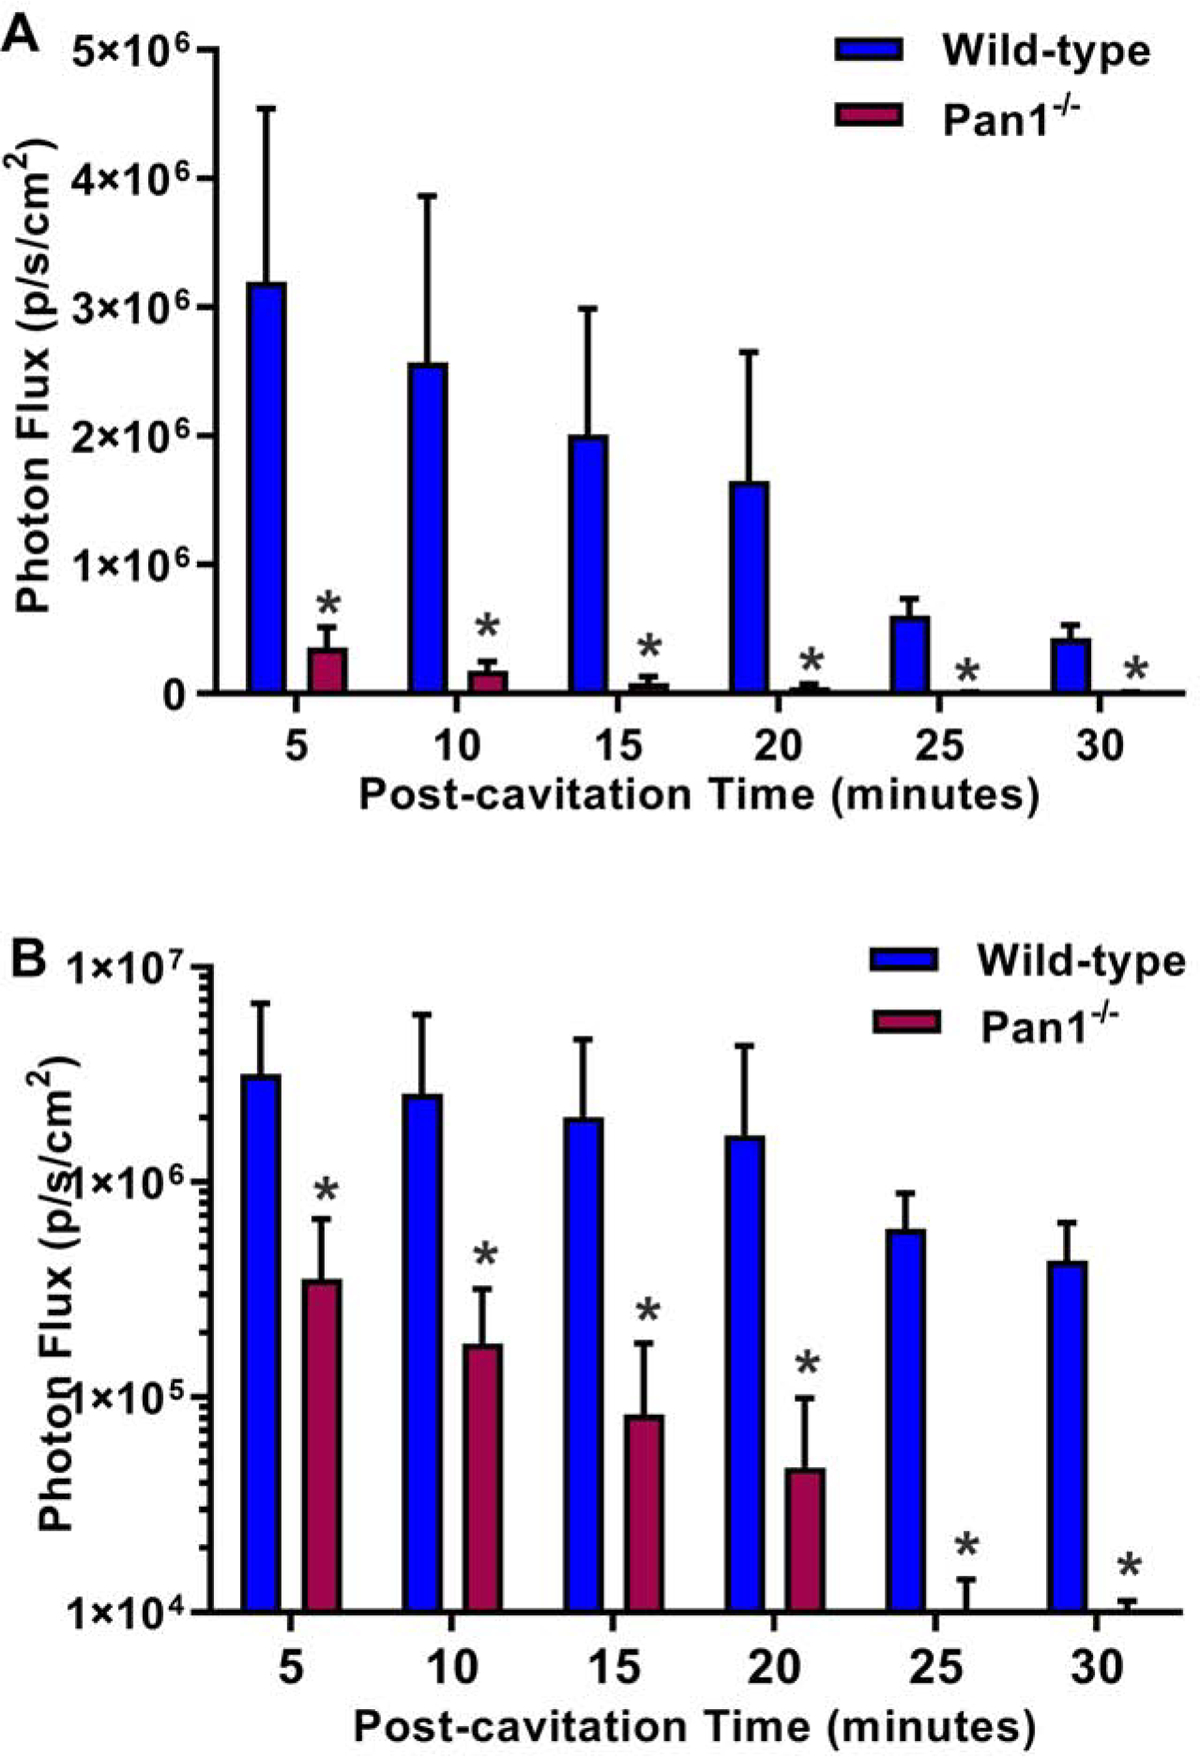
Figure 5.

Mean (±SEM) photon flux on optical imaging of ATP activity from regions-of-interest placed over the anterior chest after ultrasound cavitation in wild-type and Panx1−/− mice. Data are displayed with optical imaging data in linear (A), and log-compressed (B) scale. *p<0.05 versus Panx1−/−.
