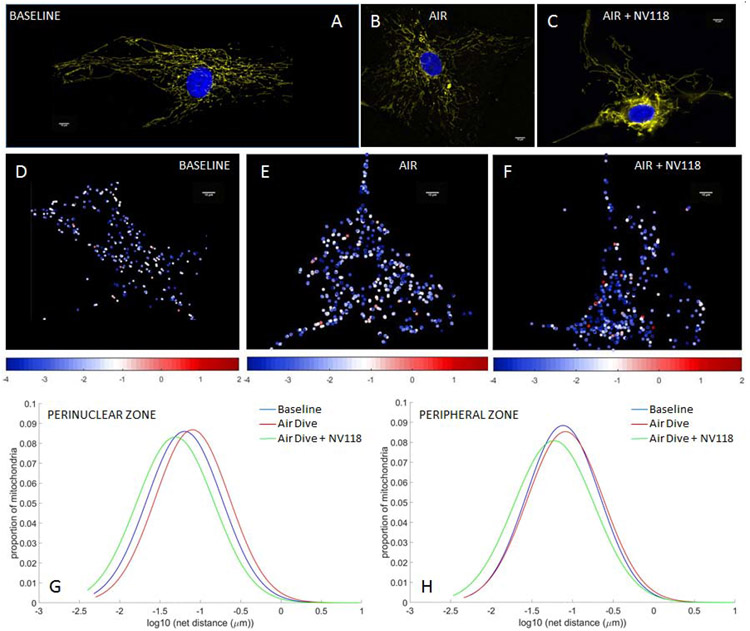
Figure 2. Alterations in mitochondrial potential and motility following decompression from hyperbaric air exposure are partially prevented by NV118 administration.
Tetramethylrhodamine, methyl ester (TMRM) fluorescence images of mitochondrial intermembrane potential in human aortic smooth muscle cells (HAoSMCs) (A) at baseline, (B) following decompression from hyperbaric air and (C) and with NV118 added prior to decompression from hyperbaric air. Cell nuclei are identified via DAPI fluorescence and appear blue. (D-F) Heat maps of individual mitochondrial net movement at baseline (D), following decompression from hyperbaric air (E) and following decompression from hyperbaric air with NV118 pretreatment (F). Each dot represents a distinct mitochondrion in its final location after tracking, and each dot’s color represents the log of the net distance traveled according to the color bar beneath the image. All size bars are 10 μm. (G,H) Lognormal distribution of net distances traveled by all mitochondria at baseline, following decompression from hyperbaric air and following decompression from hyperbaric air with NV118 pretreatment groups in the perinuclear and peripheral zone, respectively.

