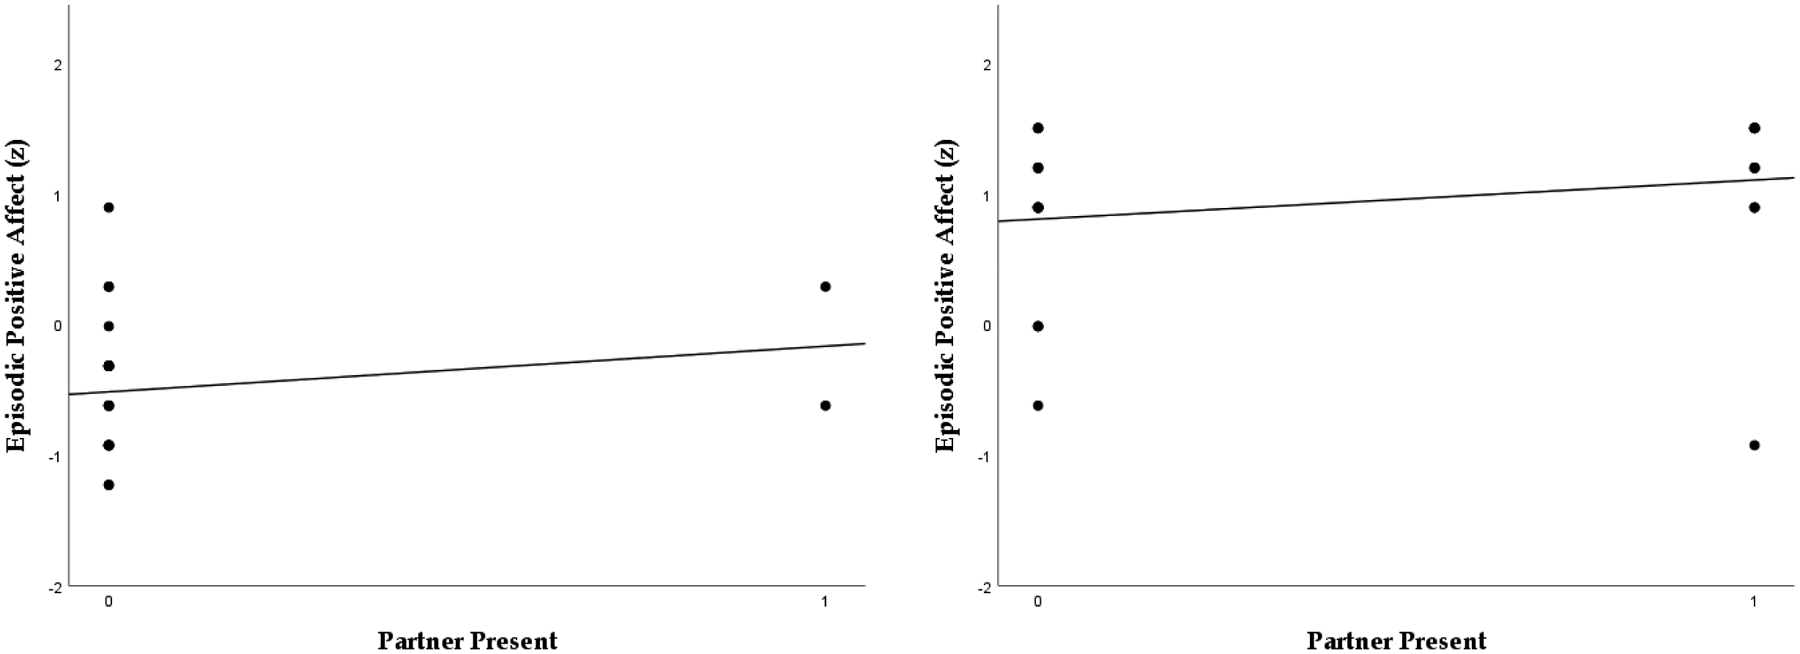
Figure A1.

Within-person scatterplots of episodic positive affect as a function of whether or not participants’ partners were present. This Figure depicts data from two individuals. The left-hand panel depicts positive affect scores for one individual when his/her partner was present versus absent. The right-hand panel depicts positive affect scores for a different individual when his/her partner was present versus absent. There is within-person variance in positive affect even within “conditions” (i.e., whether someone’s partner is present or absent). Each of the regression lines in the panels represent one of the many regression lines in the spaghetti plot depicted in Figure 2.
