
Fig. 1. Sci-fate enables joint profiling of whole and newly synthesized transcriptomes.
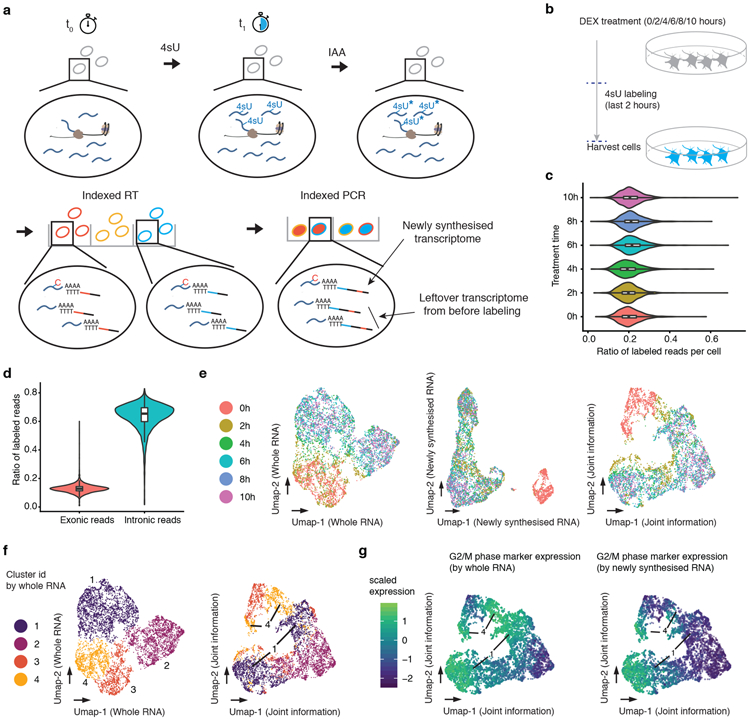
(a) The sci-fate workflow. Key steps are outlined in text. (b) Experimental scheme. A549 cells were treated with dexamethasone for varying amounts of time ranging from 0 to 10 hrs. Cells from all treatment conditions were labeled with 4sU two hours before harvest for sci-fate. (c) Violin plot showing the fraction of 4sU labeled reads per cell for each of the six treatment conditions. Cell number n = 1,054 (0h), 1,049 (2h), 949 (4h), 1,262 (6h), 1,041 (8h), and 1,325 (10h). For all violin plots in this figure: thick lines in the middle, medians; upper and lower box edges, first and third quartiles, respectively; whiskers, 1.5 times the interquartile range; circles, outliers. (d) Violin plot showing the fraction of 4sU labeled reads per cell (n = 6,680), split out by the subsets that map to exons vs. introns. (e) UMAP visualization of A549 cells (n = 6,680) based on their whole transcriptomes (left), newly synthesized transcriptomes (middle) or with joint analysis, i.e. combining the top PCs from each (right). (f) Same as left and right of panel e, respectively, but colored by cluster id from UMAP based on whole transcriptomes. (g) Same as right of panel e, but colored by normalized expression of G2/M marker genes by their overall expression levels (left) or their levels of newly synthesized transcripts (right). UMI counts for these genes are scaled by library size, log-transformed, aggregated and then mapped to Z-scores.