
Fig. 3. Inferring single cell transcriptional dynamics with sci-fate.
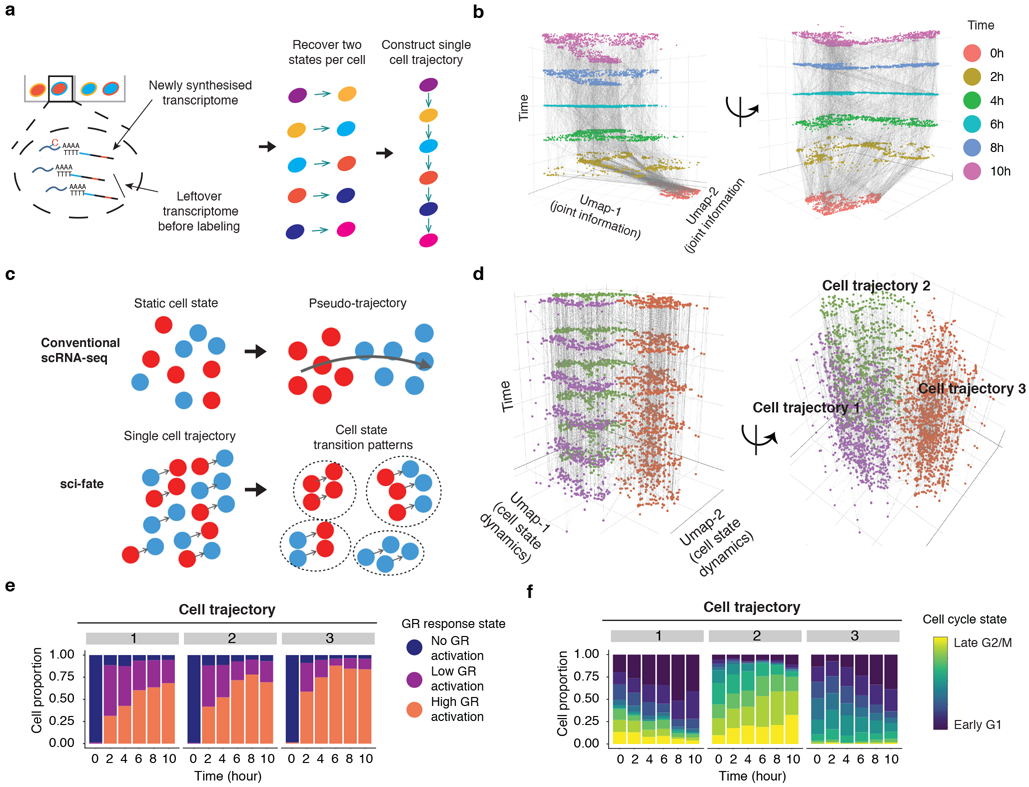
(a) Schematic of approach for linking cells based on estimated past transcriptional states to reconstruct single cell transition trajectories. (b) 3D plot of all cells (cell number n = 6,680). The x and y coordinates correspond to the joint information UMAP space shown in the rightmost panel of Fig. 1e. The z coordinate as well as colors correspond to DEX treatment time. Linked parent and child cells are connected with grey lines. (c) Schematic comparing conventional scRNA-seq and sci-fate for cell trajectory analysis. (d) Similar to panel b, except the x and y coordinates correspond to the UMAP space based on the single cell transition trajectories across the six time points (cell number n = 6,680). (e-f) Barplots showing the contributions of the 3 GR response states (e) and the 9 different cell cycle states (f) to each of three cell trajectory clusters.