
Figure 1. Extract-laden hydrogel micro-enclosures.
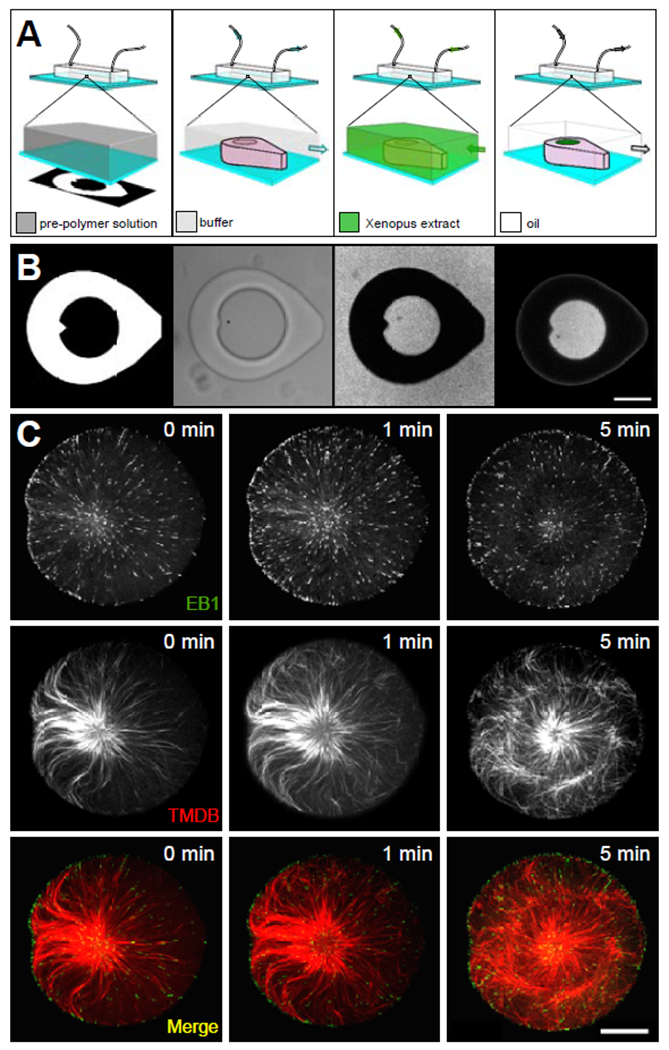
Schematic (A) and captured images (B) corresponding to the process for isolating discrete volumes of cytoplasmic extract in hydrogel micro-enclosures. The calibrated digital mask used to create hydrogel structures are pictured in the leftmost panels (see Figure S1A and Video S1). Schematic and bright-field image of the micro-enclosure (center-left panels), which is filled with Xenopus extract containing a soluble fluorophore (center-right panels) and then isolated by oil crossflow (rightmost panels). Center-right and the rightmost panel in (B) show fluorescent images of the micro-well and cytoplasmic extract visualized through EB1-GFP (scale bar in b = 50 μm). Microtubule aster formation (C) in micro-well enclosures visualized through EB1-GFP and a Tau-based fluorescent protein, mCherry-TBMD [13] (scale bar = 25 μm). 0 min corresponds to the start of the image series.