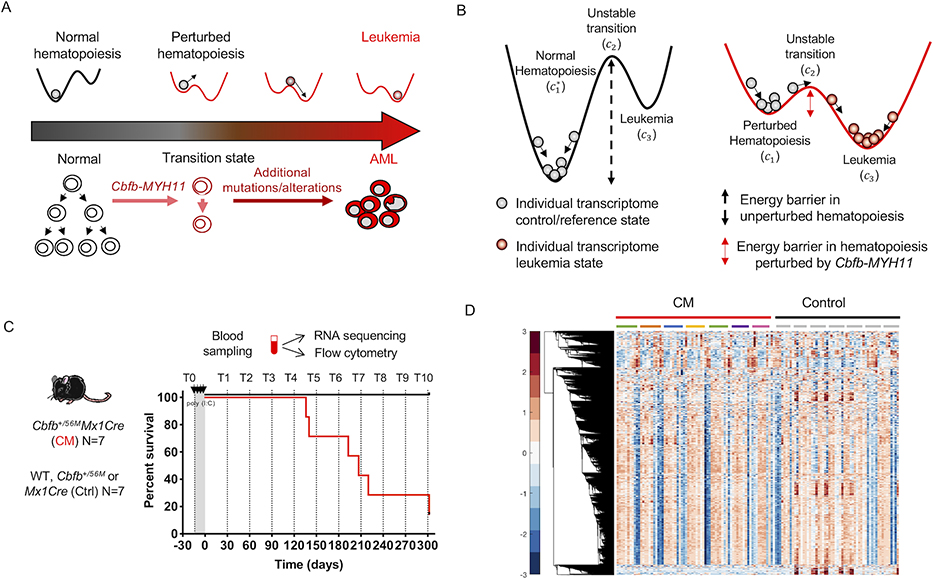
Figure 1. Leukemia as a state-transition of the transcriptome.
State-transition theory is applied to model transcriptional states over time and to identify critical points in the transition from health to leukemia, and to compute the probability of leukemia development. A) The scheme represents the temporal evolution of the transcriptome of the blood from a healthy state to a leukemia state in a longitudinal study in an AML model induced by the Cbfb-MYH11 (CM) oncogene. In the conditional CM knock-in mouse model (Cbfb+/56M/Mx1Cre), expression of CM in the adult bone marrow alters normal hematopoietic differentiation creating aberrant pre-leukemic progenitor cells which with time acquire additional genetic, epigenetic alterations needed for malignant transformation and AML development. B) We model the action of oncogenic events as a reduction in the energy barrier required to cause state-transition, and thus increase the probability of leukemia development. In unperturbed—normal—hematopoiesis, a large energy barrier between the reference state c1 and unstable transition c2 result in low probability of the state-transitioning to leukemia c3. In hematopoiesis perturbed by an AML oncogene CM, the energy barrier is reduced and therefore increases the probability of transition from c1 to c3 to a leukemia state. The * marker indicates normal hematopoiesis unperturbed by Cbfb-MYH11. C) In a cohort of CM mice (Cbfb+/56M/Mx1Cre; N=7) and littermate controls (Ctrl; N=7) lacking one or both transgenes (Cbfb+/56M or Mx1Cre), PB was sampled prior to and following CM induction (by poly (I:C) treatment) monthly for up to 10 months (timepoints T0-T10), or when mice were moribund with leukemia. Blood samples were subjected to bulk RNA-seq and flow cytometry analysis. Survival curve of CM (red line) and Ctrl (black line) mice corresponding to blood sampling time point (dashed line) are shown. D) Hierarchical clustering of row normalized (mean zero, standard deviation one) log2 transformed counts per million (cpm) reads time-series RNA-seq data for all blood samples (N= 132). Color bar shows standard deviation from the mean. Each column represents a timepoint sample, which are ordered sequentially in time and grouped by condition (CM red, Control black) and individual mice, indicated by colored bars or grey bars, respectively. Hierarchical clustering reveals similar leukemia transcriptional profiles over time which is not uniform across all mice.

