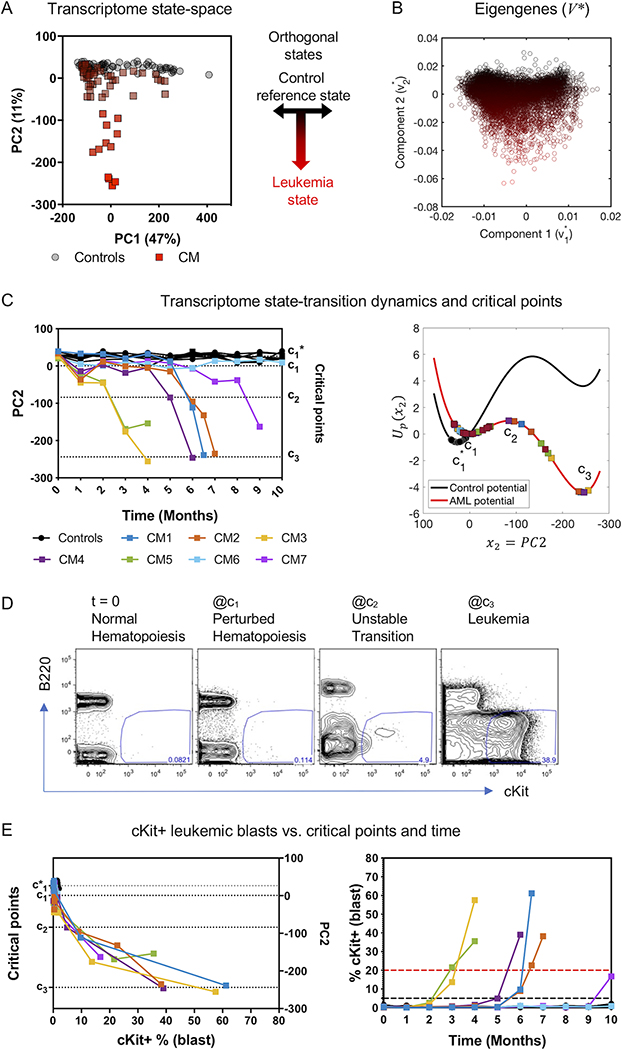
Figure 2. Construction of the transcriptome state-space and estimation of state-transition critical points.
A) The first two principal components (PCs) representing 58% of the variance in the data, and gene weights (eigengenes) corresponding to PCs are shown. The first principal component correlates with time and is likely due to the aging process (supplemental Figure S3D) and explains 47% of the variance in the data. The second principal component (PC2) explains 11% of the variance and shows a strong correlation with the appearance of differentially expressed Kit, which in this mouse model is a surrogate immunophenotypic marker for leukemic cells (supplemental Figure S3C) and encodes transition from health to leukemia. Therefore PC1 and PC2 are used create a 2D orthogonal transcriptome state-space where each dot is an individual transcriptome from control (circles) and CM (squares) mice at different time points. B) The PCA weights for all sequenced genes corresponding to the first two PCs from the loading matrix (V*). The points in A) and B) are pseudo-colored from black to red, from north to south to indicate transition to leukemia. C) Temporal dynamics and state-transition critical points. Left: Transcriptome state-space trajectories of individual mice along PC2 plotted over time (controls in black; CM induced mice in colors). Right: state-transition critical points and dynamics of PC2 mapped onto the quasi-potential energy (Up(x2)) for control and CM mice. Controls remain at the reference state () and CM induced mice transition from the reference state of perturbed hematopoiesis (c1) to the leukemic state (c3). D) Representative flow cytometry plots of leukemia blasts (cKit+) frequency detected in the blood before induction and at each critical point. B220 is a B cell lineage marker and is not expressed on leukemia blasts. E) The frequency of cKit+ leukemia blasts increases rapidly after crossing c2 transition point and increase over time as the mice develop leukemia.

