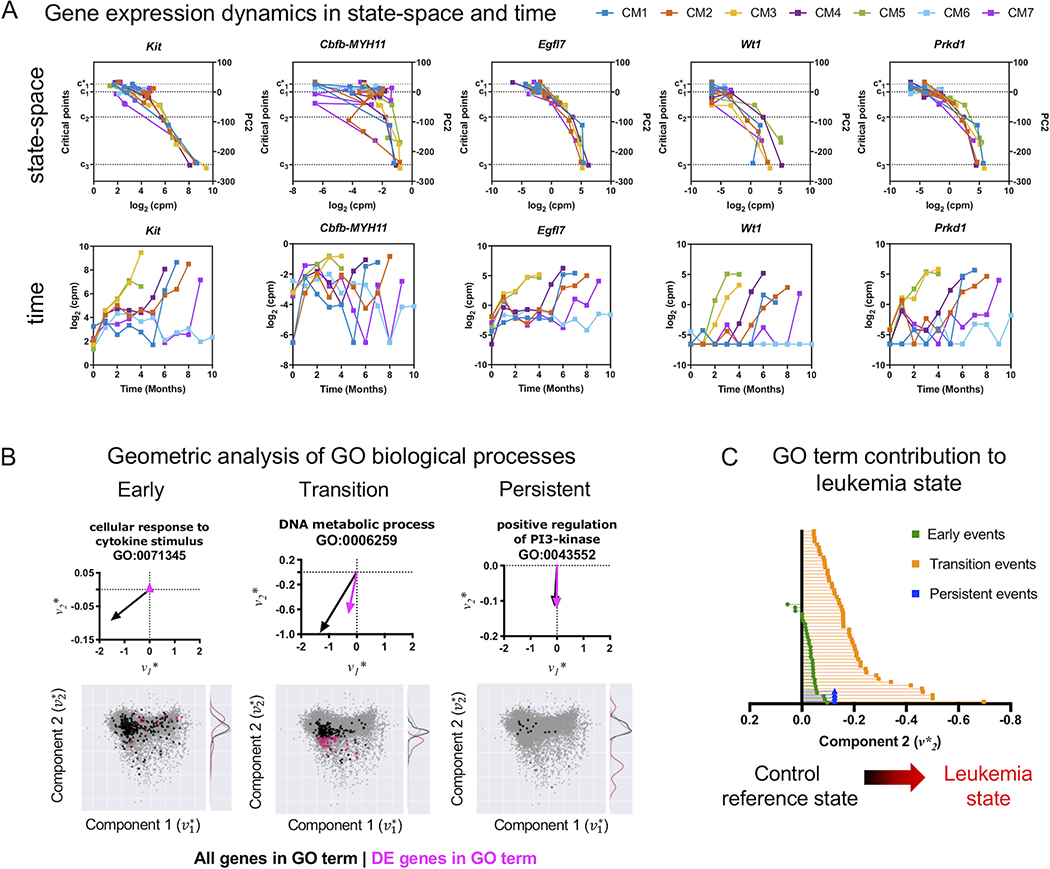
Figure 4. Geometric analysis of gene expression and quantification of pathways contribution to leukemia progression.
A) Gene expression dynamics in state-space and time. Expression levels for selected leukemia eigengenes Kit, CM, Egfl7, Wt1, Prkd1 are plotted against the state-space (PC2) (top) or plotted against time (bottom) for CM mice. Increasing expression of these genes are concordant with movement from normal hematopoiesis () to leukemia (c3) in the state-space despite the variability of expression over time. Representing gene expression dynamics in the state-space reveals alignment of gene dynamics by disease state, rather than the passage of time, which is more variable depending on when each mouse stochastically develops leukemia. B) Top: Geometric and vector analysis of GO terms overall (black) and genes (pink) that are differentially expressed (DE). The sum total of genes in a GO term (black vector) and the portion which is differentially expressed (pink vector) are used to geometrically interpret the contribution of the step-wise contribution of each GO term towards leukemia progression. Bottom: The eigengene state-space is used to represent genes and biological pathways identified through pathway enrichment analysis as vectors. Subsets of genes in a given pathway which are differentially expressed are shown in pink and the distribution along the second component is shown as a kernel density. As with the gene analysis, the larger the magnitude and more south is the pink portion of the vector, the stronger is the relative contribution of the pathway to the variance in the transcriptome associated with transition to a state of leukemia. Selected pathways for early, transition, and persistent events are shown. C) The leukemia component of the vector representation of each GO term enriched in the early, transition, and persistent events is shown. Biological pathways represented as vectors demonstrate increasing orientation in the state-space towards the state of leukemia (), with some early events pointing away from leukemia, suggesting a restorative homeostatic effect in the variance of the transcriptome. Few early events show a contribution away from the leukemia state, suggesting a homeostatic restorative force attempting to counteract the action of the leukemogenic perturbation caused by CM.

