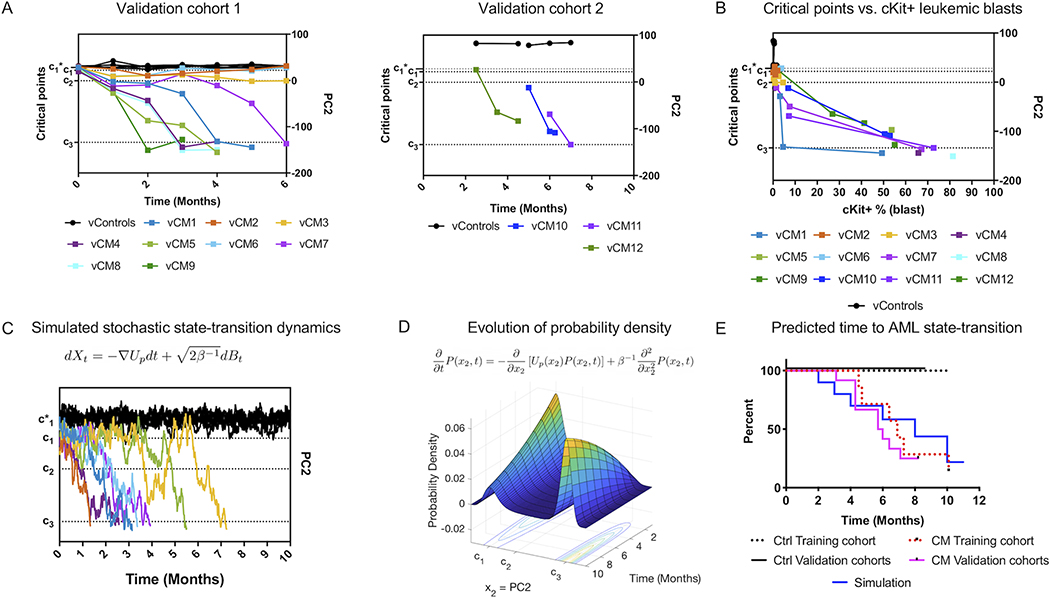
Figure 5. Validation and prediction of leukemia development in independent cohorts.
As a validation of the state-transition mathematical model, critical points, and state-space geometry, we mapped data from two additional independent experiments into the state-space: cohort 1 and cohort 2. Cohort 1 consists of 7 controls and 9 CM mice (vCM1–9) sampled at the same frequency as the training cohort. Cohort 2 consists of 2 controls and 3 CM mice (vCM10–12) sampled sparsely in time. A) Leukemia trajectories (PC2) of validation cohorts projected into the state-space constructed with the training cohort. Critical points were estimated with the same procedure as the training data set. The locations in the transcriptome state-space correctly identify controls and states of leukemia, even in cohort 2 which does not include timepoints prior to CM induction. B) The frequency of cKit+ leukemia blasts increases rapidly after crossing c2 transition point. C) The equation of motion of the transcriptome-particle in the quasi-potential is a stochastic differential equation which predicts trajectories of state-transition. One realization of a stochastic simulation is shown (controls black, CM induced mice in colors). Controls remain at the reference state () and CM induced mice transition from the reference state of perturbed hematopoiesis (c1) to the leukemic state (c3). D) Due to the stochastic nature of the biological processes and variability in RNA-seq data, we predict state-transition by considering the spatial-temporal evolution of the probability density (P(x2,t)) given by numerically solving the Fokker-Planck equation with initial conditions and simulation parameters determined by the training cohort. E) The predicted (simulated) time to state-transition is calculated by integrating the probability density. The predicted time to develop leukemia is compared to the observed time to leukemia with a survival analysis for validation cohorts (cohort 1 and 2; CM n=12; Ctrl n=9). Survival curves for the training cohort is also shown (red dashed lines, CM=7; black dashed lines, Ctrl n=7). The observed and simulated time to AML are not statistically different from each other (p >> 0.05).

