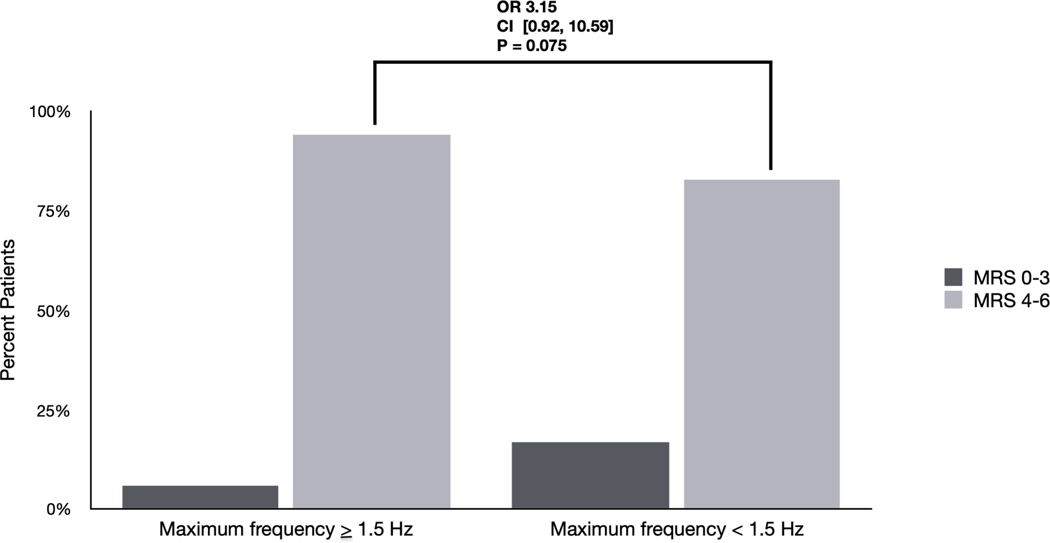
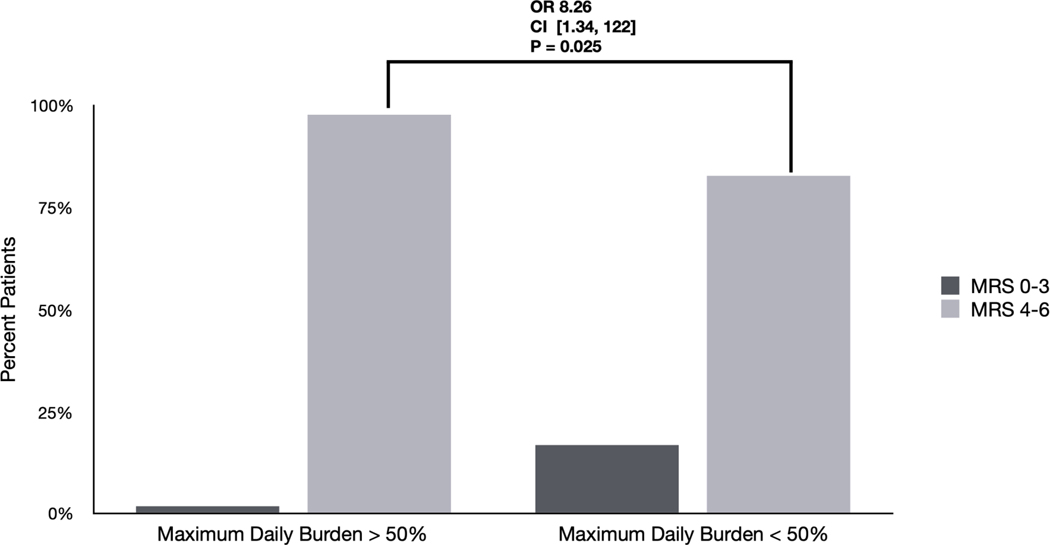
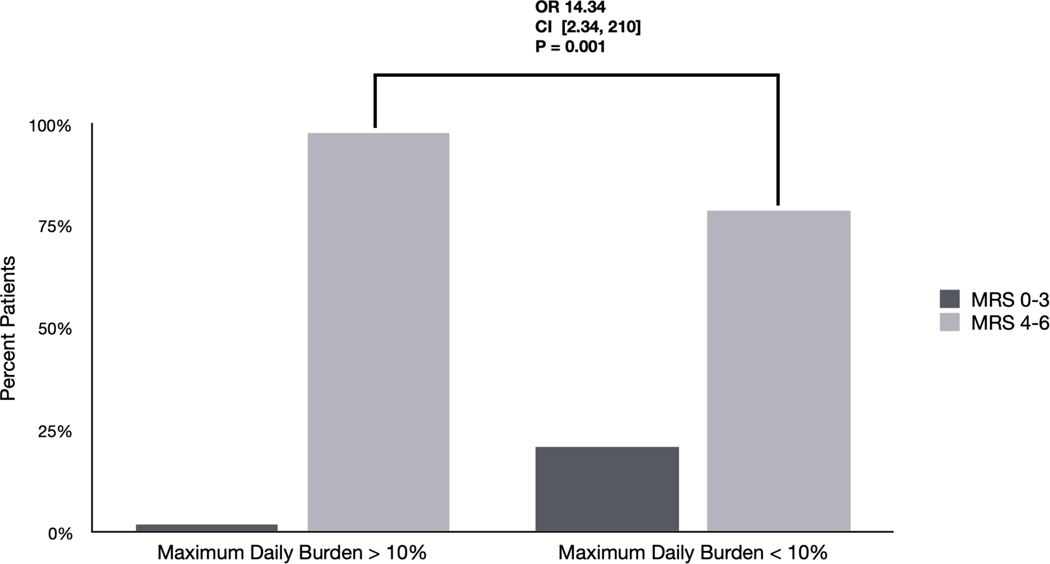
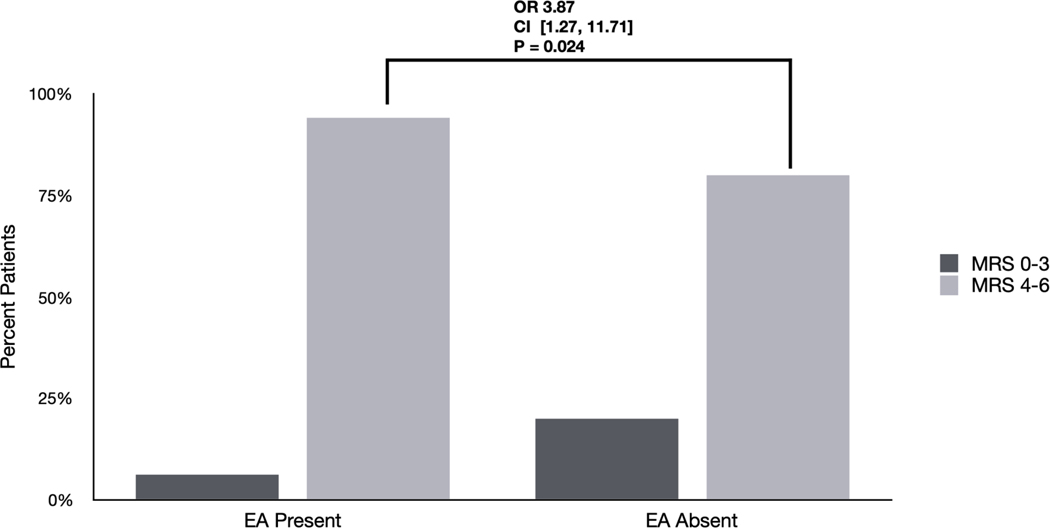
Figure 1. Differences in outcomes based on EA burden and frequency: Univariate analyses.
A) Differences in outcomes between patients with EAs based on presence vs. absence. 94% of patients with EAs had poor outcomes (mRS 4–6) compared with 80 % without EAs (OR 3.87 [1.27 – 11.71] p=0.024).
B) Differences in outcomes among patients with maximum daily burden > 10%. 98% of patients with a maximum daily burden > 10% had poor outcomes (mRS 4–6) compared with 79% of patients with maximum daily burden < 10% (OR 14.34 [2.34–210] p=0.001).
C) Differences in outcomes among patients with EAs based on maximum daily burden >50%. 98 % of patients with a maximum daily burden of >50% had poor outcomes (mRS 4–6) compared with 83% of patients with a maximum daily burden < 50% (OR 8.23 [1.34 – 122] p=0.025).
D) Differences in outcomes among patients with EAs based on maximum frequency ≥ 1.5Hz. 94 % of patients with a maximum frequency ≥ 1.5Hz had poor outcomes (mRS 4–6) compared with 83% of patients with maximum frequency < 1.5 Hz (OR 3.15 [0.92–10.59] p=0.075).
EAs: Epileptiform abnormalities


