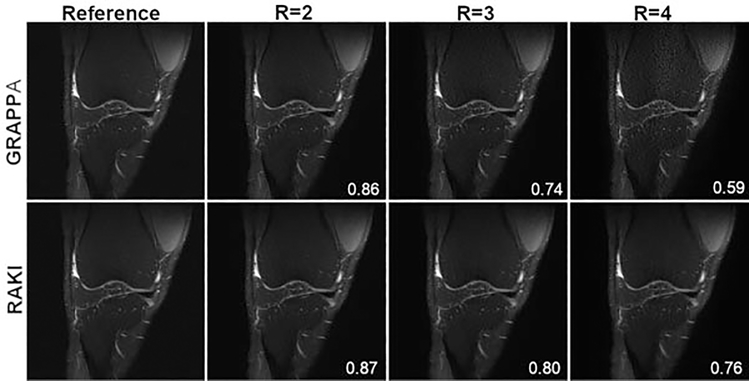
Fig. 5.
The left column presents a single slice of the reference proton-density fat-suppressed (PD-FS) knee image. Columns 2, 3, and 4 show the undersampled reconstructions for acceleration factor (R) R = 2, R = 3, and R = 4. The top row shows the GRAPPA reconstructions, and the bottom row shows the RAKI reconstructions. The structural similarity index measure is higher for the RAKI reconstruction for all acceleration factors.

