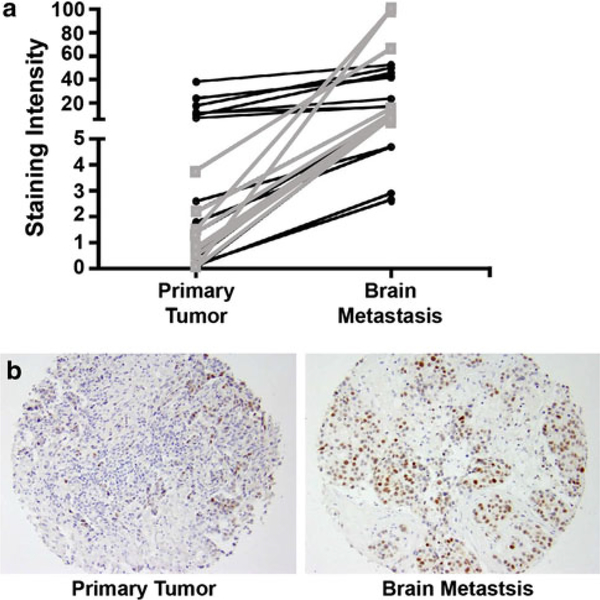
Fig. 3.
p53 immunoreactivity on a tissue microarray of matched resected primary breast tumors and brain metastases. a Graph represents the magnitude of increase in immunoreactivity between a primary tumor and the matched brain metastatic lesion. Grey (squares) show patient matched samples with the greatest increase from low primary tumor expression to high brain metastasis expression. b Representative images of low staining in a primary tumor sample and high staining in the corresponding brain metastasis sample

