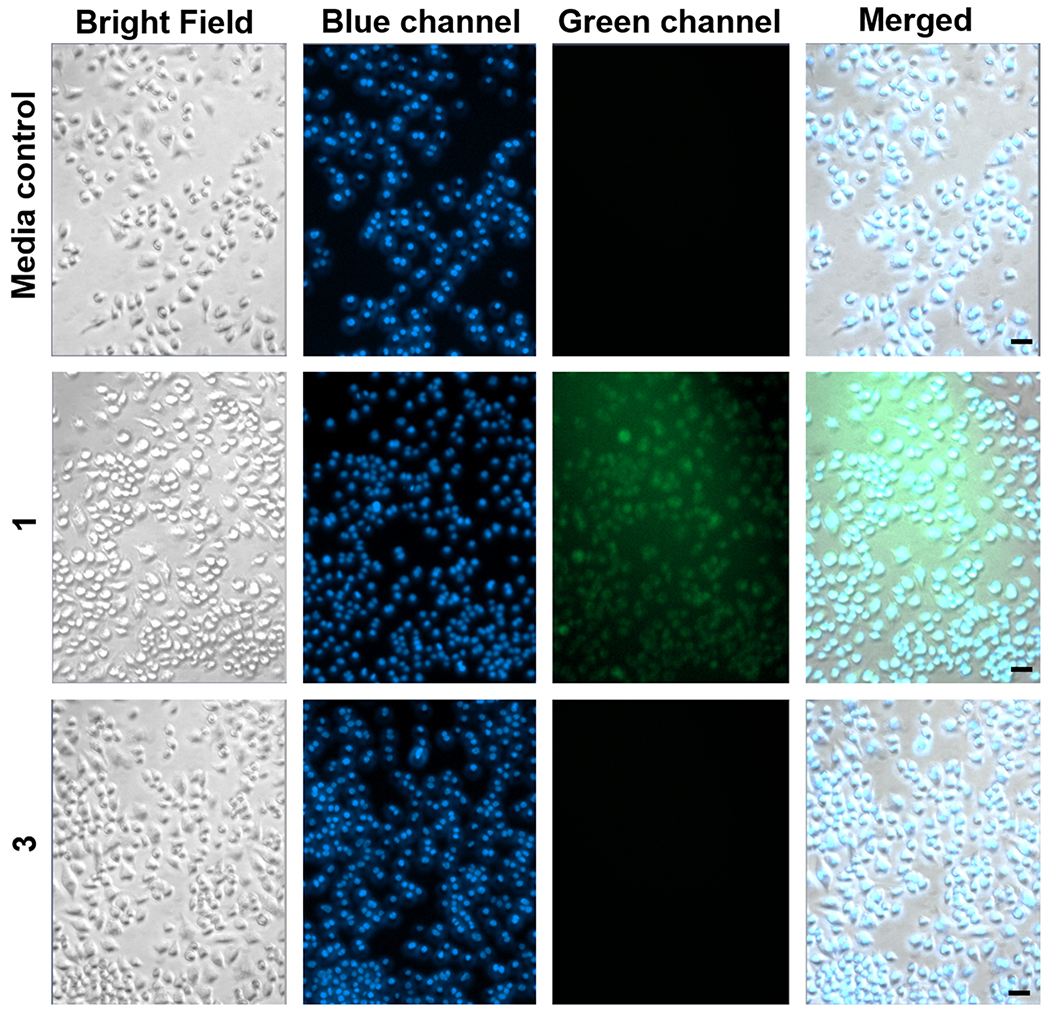
Figure 3.
Fluorescence microscopy images of RAW 264.7 cells incubated for 4 h with 1 or 3 (50 μM) followed by washing of the cells prior to imaging. Row 1: Media control for all experiments. Row 2: Cells exposed to 1. Row 3: Cells exposed to 3. The observed green fluorescence in Row 2 is from cytosolic 1. The lack of green emission in Row 3 implies that 3 was not taken up by cells. The cells were co-stained with Hoechst 33342 nuclear dye (blue) to assess cell integrity. Size of bar = 20 μm.

