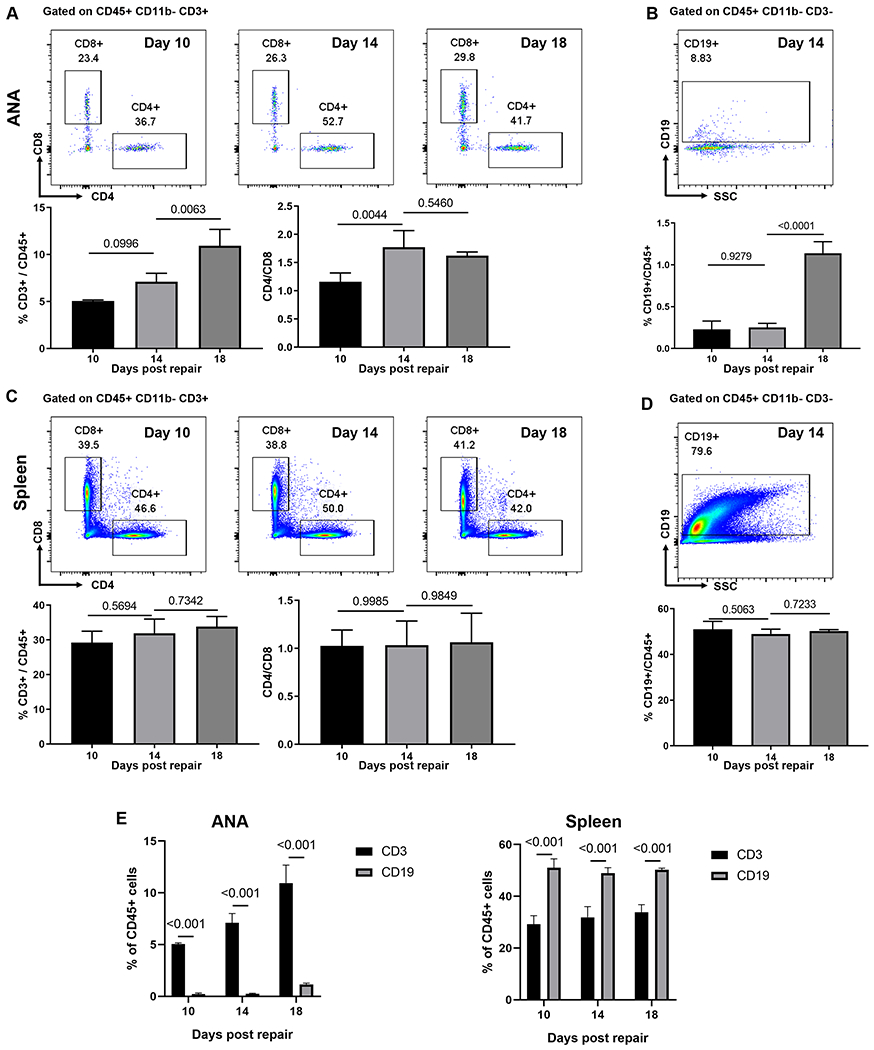
Fig 2.

T cells but not B cells accumulate within ANAs. A) Representative flow cytometry analysis for CD4 and CD8 T cells within ANA. Cells were gated on CD45+CD11b−CD3+. Total T cells relative to hematopoietic cells (CD3/CD45) and the proportion of CD4 to CD8 T cells were quantified. B) Representative flow cytometry and quantification of B cells (CD19) within ANA. Cells were gated on CD45+CD11b−CD3−. C) Representative flow cytometry and quantification of CD4 and CD8 T cells from spleen. Cells were gated on CD45+CD11b−CD3+. D) Representative flow cytometry and quantification of B cells from spleen. Cells were gated on CD45+CD11b−CD3−. E) Comparative analysis of CD3 T cells and CD19 B cells as proportion of CD45 cells within ANAs and spleen. . Mean ± SD, n=3/group; p values shown.
