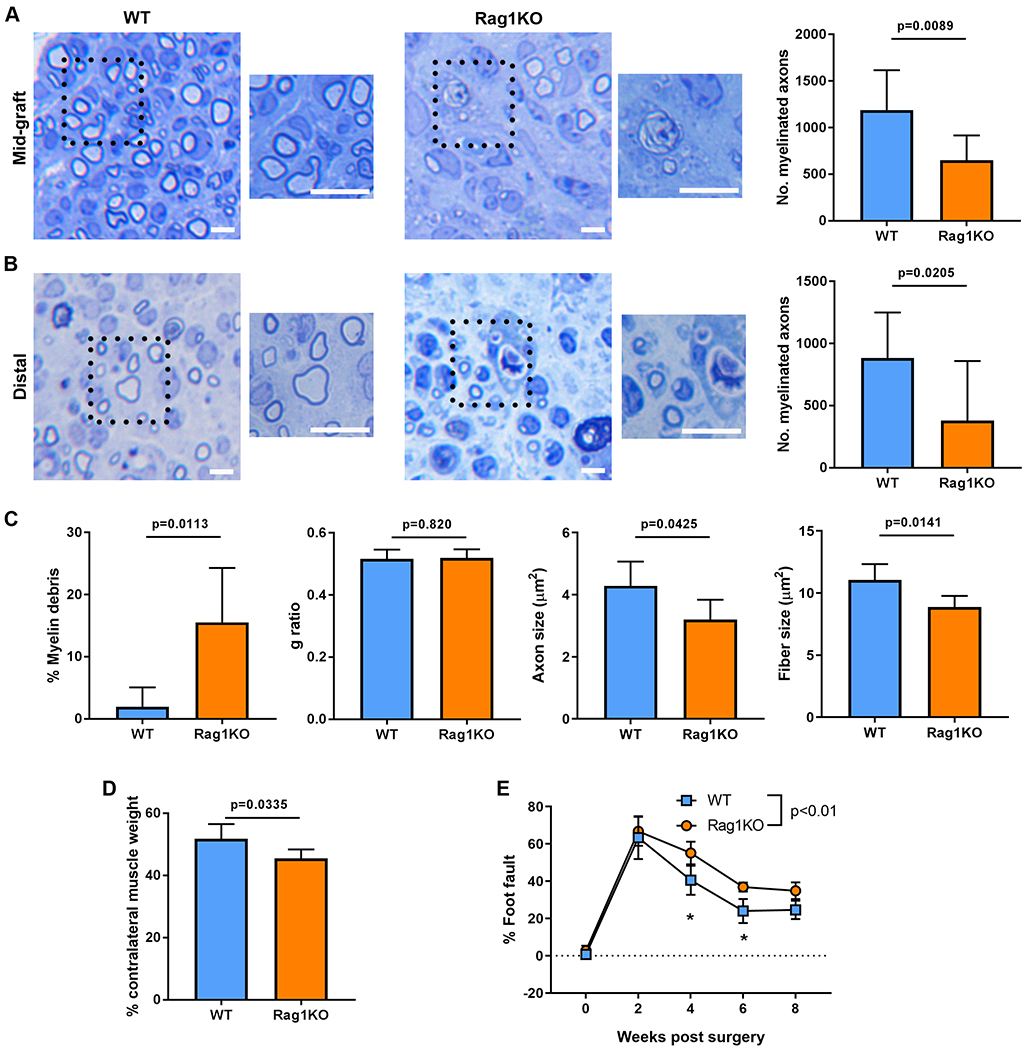
Fig 4.

Functional regeneration of nerve across ANAs in Rag1KO mice is impaired. At 4 weeks after ANA repair, representative histological images and quantification of myelinated axon regeneration in the mid-graft of ANA (A) and distal nerve (B). C) Additional quantification of histomorphometric data from the mid-graft of ANA. D) Relative (to uninjured side) weight of gastrocnemius muscle at 4 weeks. E) Functional assessment (behavior) following ANA repair over time. Mean ± SD, n=8/group histology and muscle assessment at 4 weeks; n=5/group functional assessment; p values shown or indicated by * for group comparison at an endpoint. Scale bar represent 10 μm, insert scale bar represent 25 μm.
