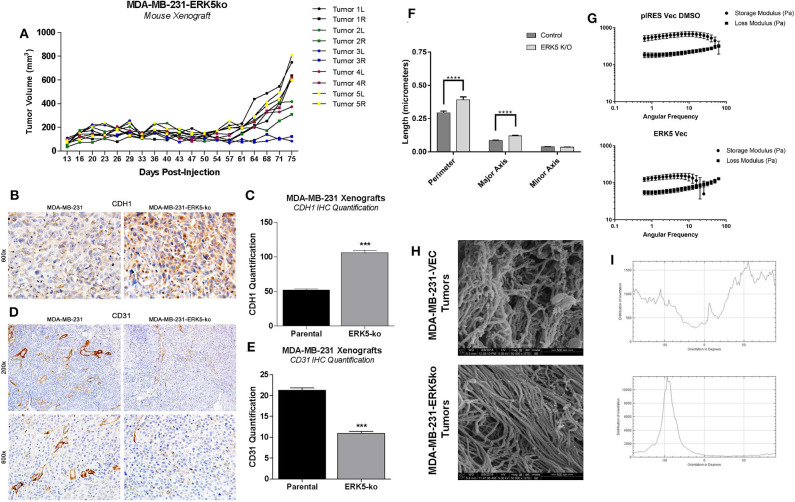
Figure 4.
ERK5-ko suppresses angiogenesis and increased CDH1 expression of MDA-MB-231 xenografts and require ECM components to restore tumor growth. (A) SCID/Beige mice were inoculated bilaterally with MDA-MB-231-ERK5-ko (in vector) cells with high concentration Matrigel™ (HC MG; n = 5 mice) in independent experiments (5 × 10⁶ cells/injection). Cells were injected in the mammary fat pads bilaterally and individual tumor growth is represented, with right and left tumors indicated by “R” and “L”, respectively. MDA-MB-231-ERK5-ko tumors formed after a prolonged time period when injected with high concentration Matrigel™. Tumors were measured twice weekly with a digital caliper. Data points represent average tumor volume (mm3) ± S.E.M. (B) After resection the harvested tumors were formalin fixed, paraffin-embedded and sectioned. Immunohistochemistry for CDH1 performed in xenografts demonstrated a significantly higher expression of E-Cadherin in the cytoplasm of ERK5 knockout tumor cells compared with the MDA-MB-231 parental control cell line. (C) The number of CDH1 positive cells was counted in 12 fields of 600× magnification. ***p < 0.001. (D) Blood vessels were highlighted by CD31 positive immunohistochemistry staining. (E) The number of blood vessels in the ERK5 knockout tumors was significantly lower than their control parental counterparts, evident at both 200× and 600× magnification. (F) Quantification of extracellular matrix fibers within tumors derived from MDA-MB-231-ERK5-ko or -parental cell xenografts. Relative organization of the aligned fibers is also shown. A computer learning program was trained to distinguish between “fibers” and “non-fibers” based on pixel values; “pores” were defined as regions of non-fiber surrounded by fiber. Relative porosity between the tumor groups were quantified based on measurements of the “pore” regions (perimeter, major and minor axis diameters). The total number of pores analyzed were 637 and 500 in 50,000× images and 932 and 902 pores in 25,000× images for control and ERK5-ko decellularized tumors, respectively. One image for each magnification was quantified per group. ****p < 0.0001. (G) Rheometer analyses of decellularized tumors. Storage modulus (Pa) and loss modulus (Pa) are represented in the graphs. Less solid tumors are associated with intersection of storage and loss moduli at a lower angular frequency. (H) Representative images of cryogenic scanning electron microscopy of decellularized tumors derived from MDA-MB-231-VEC and -ERK5-ko cell lines. Images are shown at 50,000× magnification. (I) Relative orientation and alignment of ECM fibers visualized in the scanning electron microscopy images. Orientation is shown on the x-axis (degrees) and distribution of orientation is shown on the y-axis.

