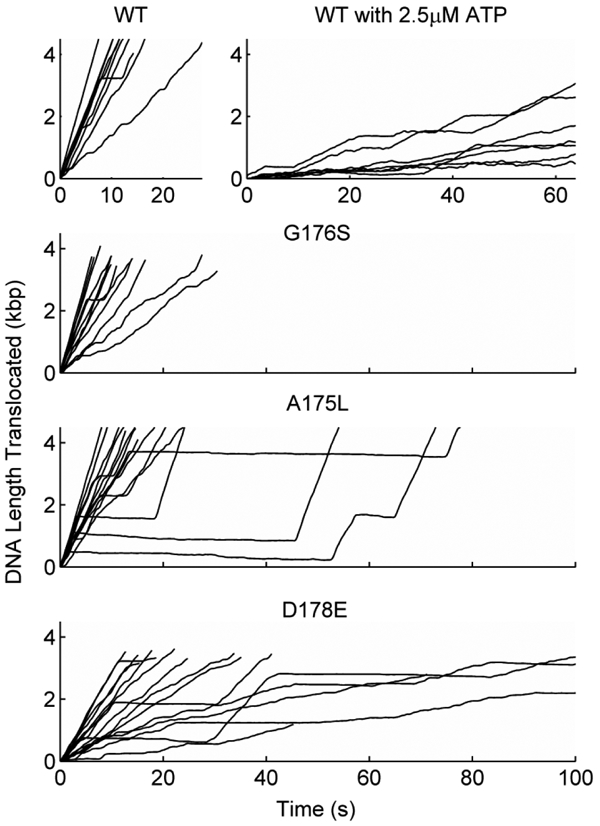
Figure 6. Examples of single DNA molecule translocation measurements for wildtype terminase (WT) and mutants G176S, A175L, and D178E as indicated.

All plots are of DNA length translocated (kpb) vs. time (seconds) and the bottom three plots share the same horizontal axis tick labels as indicated on the bottom plot. All measurements are with saturating ATP (500 μM) except for the WT measurements labeled 2.5 μM ATP.
