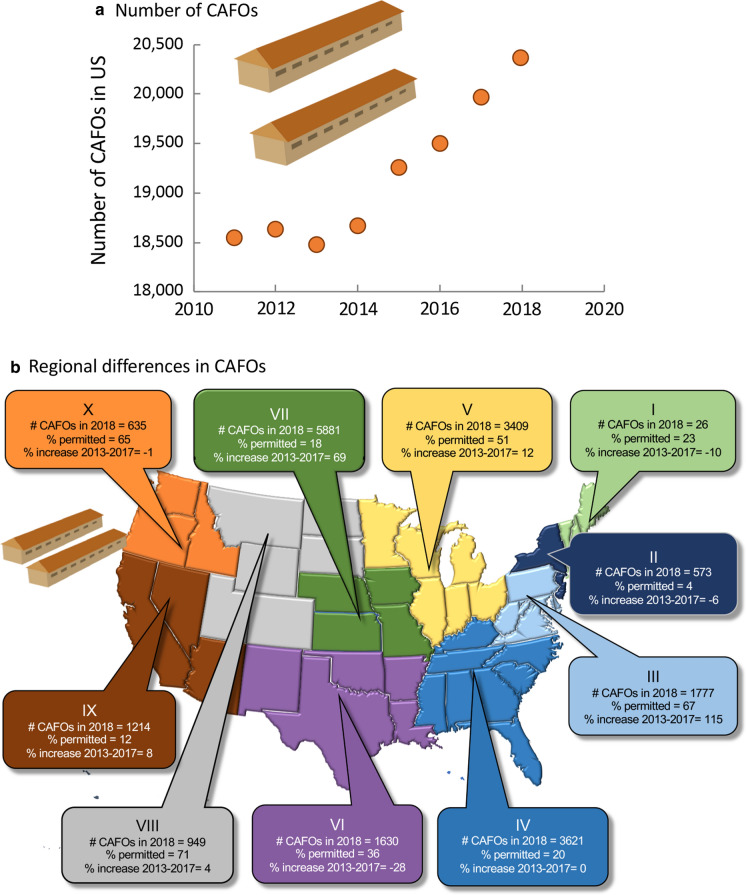
Fig. 11.
a Total US changes in CAFOs from 2011 to 2018, b numbers of CAFOs by US region in 2018, their percent change from 2013 to 2017 and percent permitted. Data are from EPA (https://www.epa.gov/sites/production/files/2019-09/documents/cafo_tracksum_endyear_2018.pdf) and USDA as summarized by Walljasper (data 2011–2017, https://investigateMidwest.org/2018/06/07/large-animal-feeding-operations-on-the-rise/). Symbols used are from Vectorstock used under an expanded license. The 10 regions of the US are as designated by the Office of Management and Budget (see also Online Resources Fig. 1). Note that Hawaii is included in Region IX and Alaska in Region X

