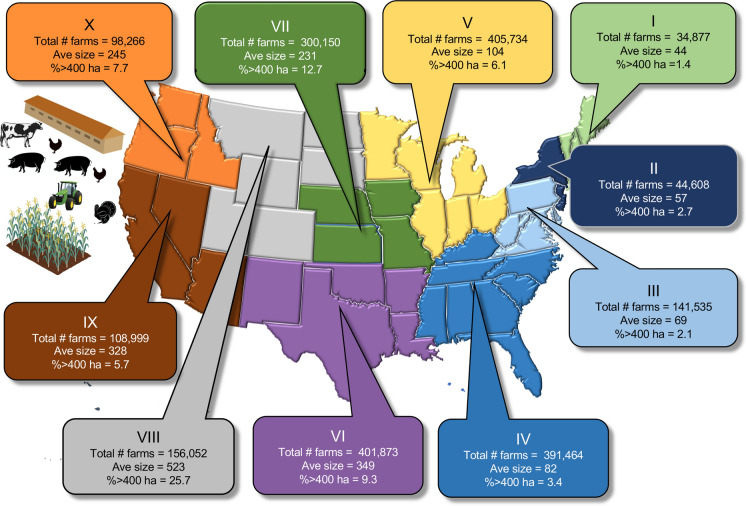
Fig. 2.
Farm inventory (as total number of farms, average size (ha), and percent with > 400 ha by region of the country. Data are based on 2012 and are summarized from https://cropinsuranceinamerica.org/in-the-states/. The 10 regions of the US are as designated by the Office of Management and Budget (see also Online Resources Fig. S1). Note that Hawaii is included in Region IX and Alaska in Region X. The farm icons are from the UMCES-IAN image library

