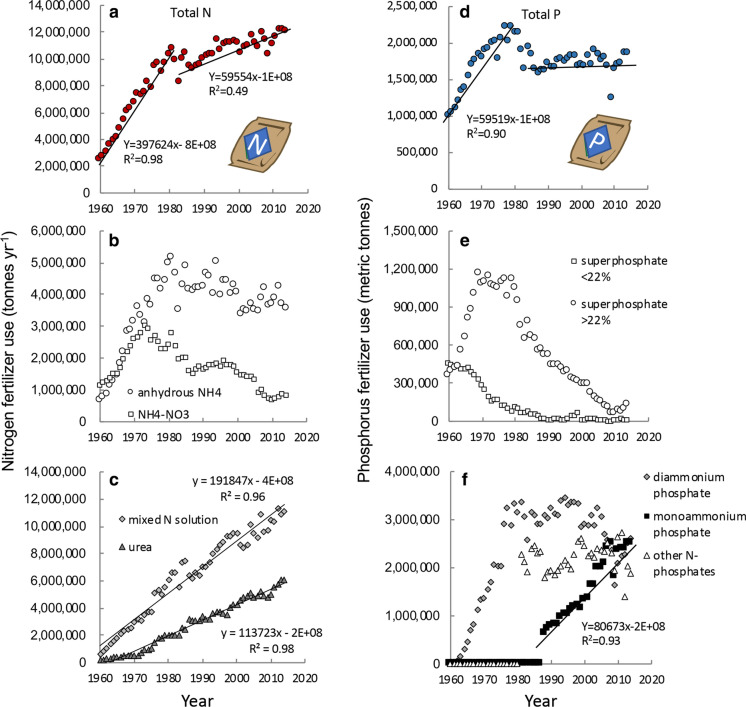
Fig. 3.
Change in nitrogen and phosphorus fertilizer use in the US over time as a total nitrogen, b anhydrous NH4 and NH4–NO3, c mixed N solutions (urea-NH4–NO3 and urea), d total phosphorus (as P), e superphosphates, and f combined N-phosphorus solutions. Data are from https://www.ers.usda.gov/data-products/fertilizer-use-and-price. Trend lines are shown to highlight specific relationships described in text. Icons are from the UMCES-IAN image library

