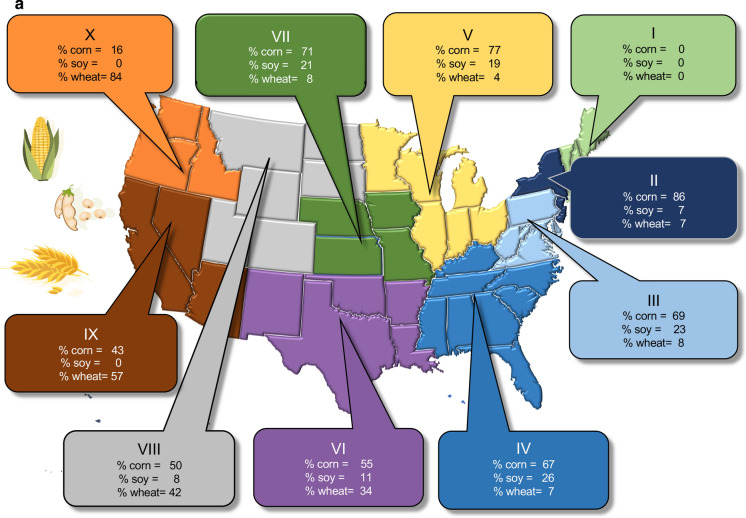
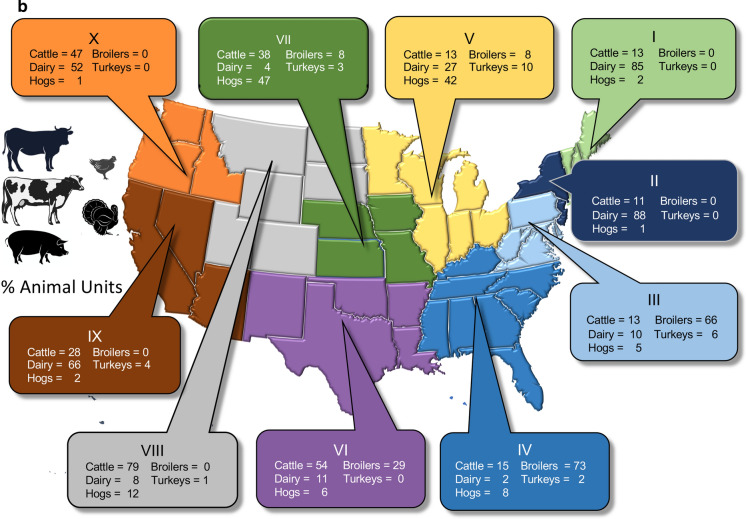
Fig. 5.
a Percent of corn, soybean and wheat grown in the 10 regions of the US designated by the Office of Management and Budget (see also Online Resources Fig. S1). b Percent of cattle, dairy, hogs and poultry production for the same US regions, as based on equivalent animal units (see text for explanation). Data are from 2019 from https://www.nass.usda.gov/Statistics_by_State/index.php. Symbols and icons are from Vectorstock used under an expanded license


