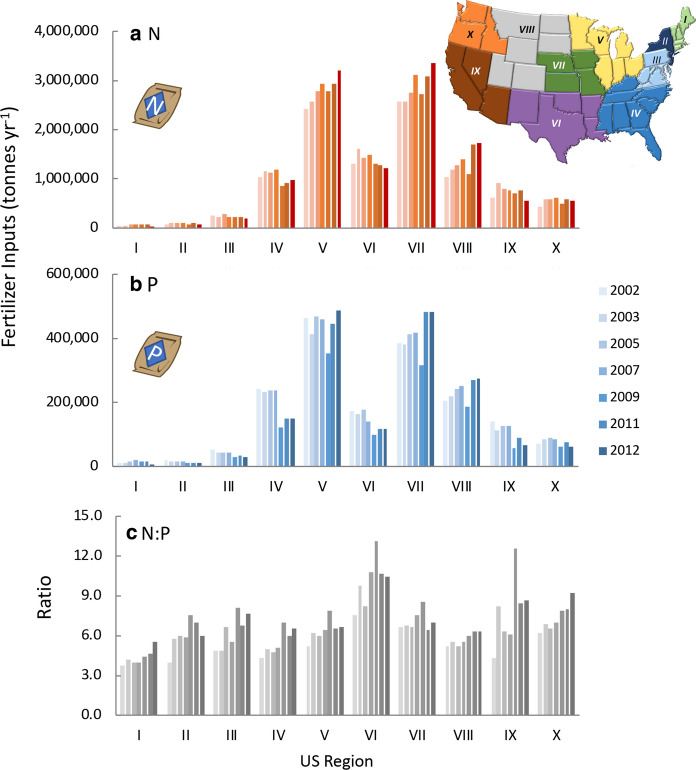
Fig. 9.
a Nitrogen fertilizer purchased by region of the country from 2003 to 2012 and percent change (b) As for (a) except for P fertilizer. Data from 2003 to 2011 are from the US EPA (https://www.epa.gov/nutrient-policy-data/commercial-fertilizer-purchased). Data for 2002 and 2012 for N were obtained from Sabo et al. (2019), and data for P for the same years are from US EPA (10.23719/1504278). c The ratio of N:P (by weight) for the same years. The 10 regions of the US are as designated by the Office of Management and Budget (see also Online Resources Fig. S1). Note that Hawaii is included in Region IX and Alaska in Region X

