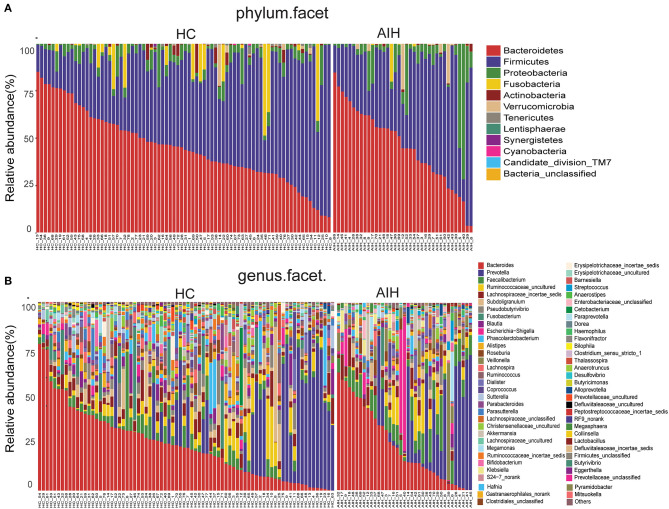
Figure 11.
Composition of fecal microbiota on taxonomic level between AIH (n = 37) (right) versus HCs (n = 78) (left). The microbial community barplot of AIH and HCs visually reflected the relative abundance of microbiome at (A) phylum level and (B) genus level for each sample. AIH, Autoimmune hepatitis; HCs, healthy controls.

