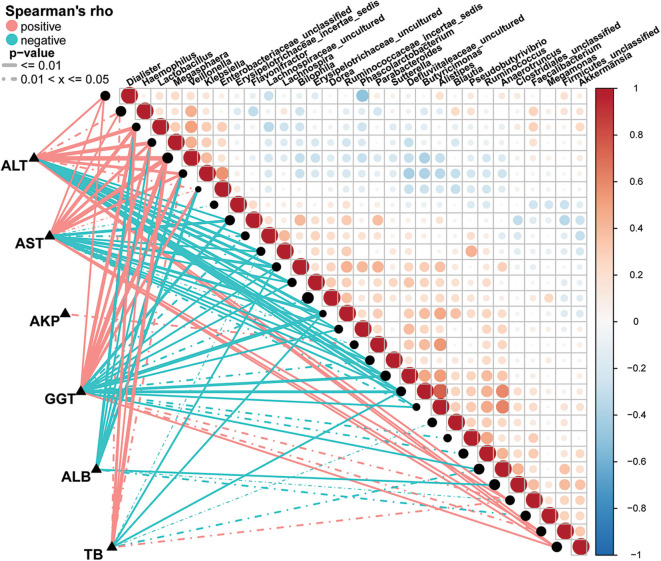
Figure 7.
Associations between fecal microbiomes and AIH disease status. Heatmap showing partial Spearman's correlation coefficients among 30 genera and clinical AIH indices. Positive values (red) indicate positive correlations. Negative values (blue) indicate inverse correlations. Solid lines represent P ≤ 0.01. Dotted lines represent 0.01 < P ≤ 0.05. Intensity of shading in circles is proportional to the magnitude of the association. Correlation direction was determined by Spearman's method. *P < 0.05; **P < 0.01; ***P < 0.001; AIH, autoimmune hepatitis; AST, aspartate aminotransferase; ALT, alanine aminotransferase; GGT, γ-glutamyltransferase; TB, total bilirubin; ALB, albumin; AKP, alkaline phosphatase.

