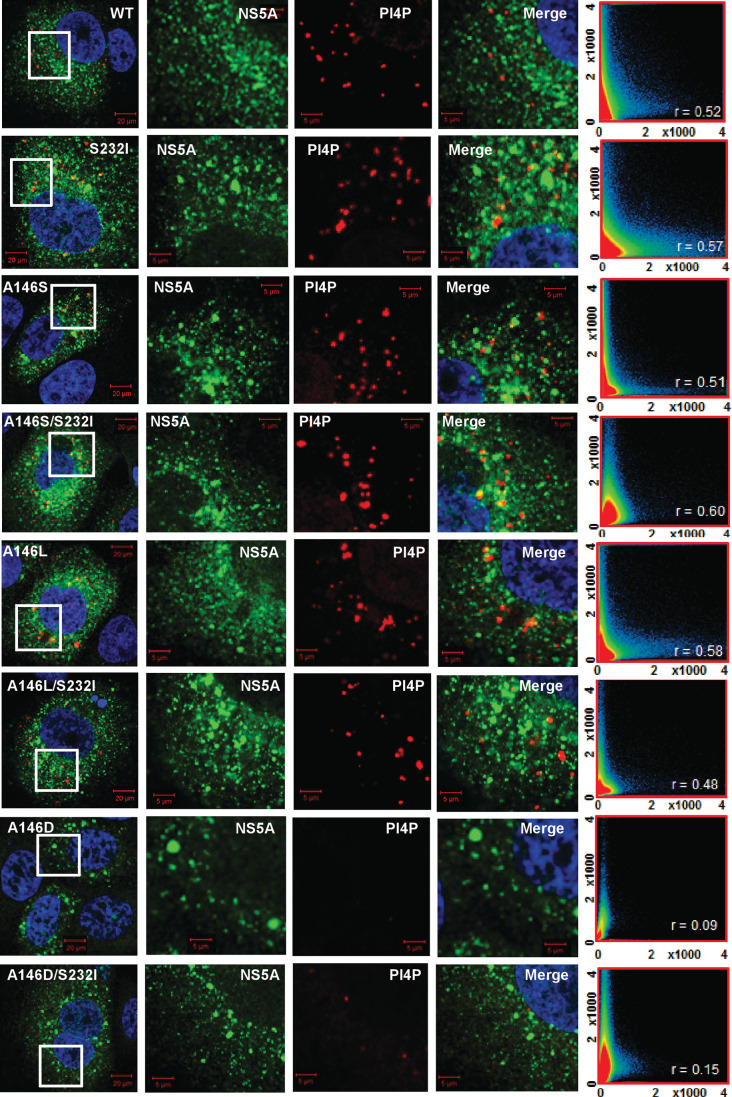
Fig. 6.
Colocalization of NS5A and the lipid phosphatidylinositol-4 phosphate (PI4P). Huh7 cells were electroporated with in vitro transcripts of the indicated SGRs, and seeded onto coverslips. At 48 h p.e. cells were fixed and immunostained for NS5A and PI4P lipids (mouse monoclonal), prior to imaging by confocal microscopy. White boxes indicate the area expanded in the right-hand panels. Colocalization scatter plots are of a 200×200 µm area containing >10 cells, and show the correlation of absolute values. The correlation value, r, is shown for each image.

