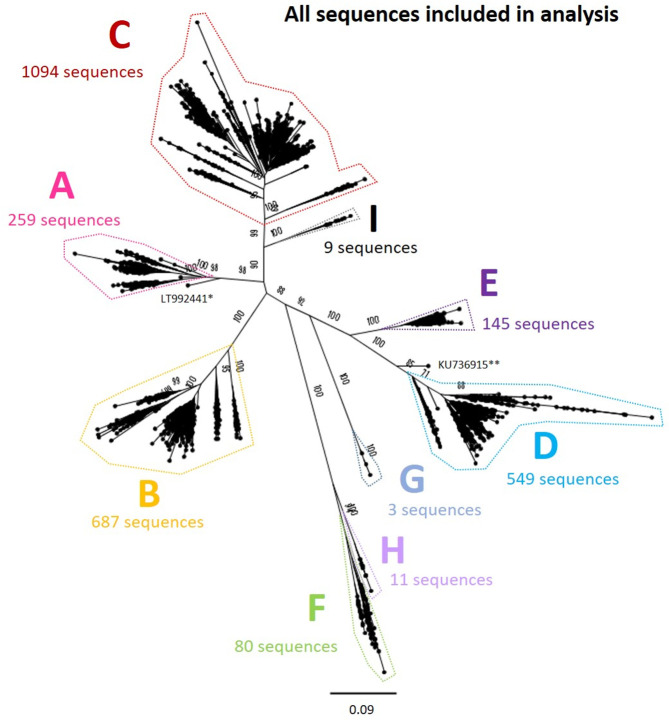
Fig. 2.
Genomic-length maximum-likelihood phylogeny of all genotype A–I HBV sequences included in analysis (n=2839) after removing highly similar sequences, indicating the number of sequences in each genotype analysed separately (Figs 3–10). Bootstrap support ≥70 after 1000 replicates is given for the deepest branches on the tree. The scale bar indicates the estimated nucleotide substitutions per site. *, a strain known to be from a 14th century skeleton clustering distantly with genotype A, LT992441, was removed from the subsequent analysis. **, KU736915 was identified as a genotype D/E recombinant and removed from the subsequent analysis.

