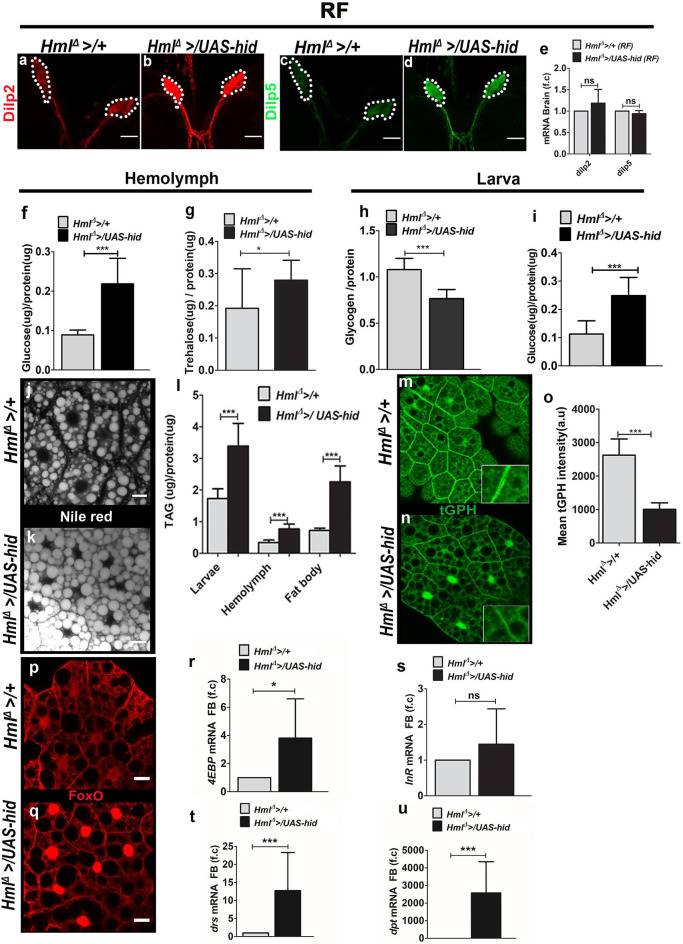
Figure 2.
Ablation of Hml+ plasmatocytes regulates fat body insulin sensitivity and inflammatory homeostasis. In (a–d,j,k,p,q), scale bar = 20 μm. In (e–i,l,o,r–u) bar graphs represent mean ± standard deviation (SD). Statistical analysis, unpaired t-test, two-tailed in (e–i,l,o,r–u). “n” is the total number of larvae analyzed, RF is regular food, FB is fat body, f.c is fold change, a.u is arbitrary units. (a–e) Dilp2 and Dilp5 analysis in feeding L3 larval brains. Immunostainings of (a,b) Dilp2 and (c,d) Dilp5 peptides. As compared with (a,c) control (HmlΔ >/+), (b,d) HmlΔ >/UAS-hid larval brains reveal increased Dilp2 and Dilp5 peptide expression in insulin-producing cells (IPCs). (e) qPCR analysis for dilp2 and dilp5 in brain tissue of feeding L3 larvae does not show any change in their relative mRNA expression. Relative fold change is represented and statistical analysis was performed on Ctvalues (dilp2; HmlΔ >/+, n = 70, 4 ± 0.32; HmlΔ >/UAS-hid, n = 80, 3.77 ± 0.71 and dilp5; HmlΔ >/+, n = 70, 9.25 ± 0.18; HmlΔ >/UAS-hid, n = 80, 9.34 ± 0.29). (f) Hemolymph glucose levels. HmlΔ >/+, n = 78, 0.09 ± 0.01 and HmlΔ >/UAS-hid n = 78, 0.22 ± 0.06 (***p-value < 0.0001). (g) Hemolymph trehalose levels. HmlΔ >/+, n = 90, 0.19 ± 0.10 and HmlΔ >/UAS-hid, n = 72, 0.28 ± 0.06 (*p-value = 0.0335). (h) Whole-larvae glycogen levels. HmlΔ >/+, n = 6, 1.08 ± 0.12 and HmlΔ >UAS hid, n = 6, 0.77 ± 0.1 (***p-value = 0.0006). (i) Whole-larvae glucose levels. HmlΔ >/+, n = 39, 0.11 ± 0.05 and HmlΔ >/UAS-hid, n = 39, 0.25 ± 0.06 (***p-value < 0.0001). (j,k) Neutral lipid staining (Nile red) in fat bodies of (j) HmlΔ >/+ and (k) HmlΔ >UAS-hid. Compared with control, (j) HmlΔ >/+, (k) HmlΔ >UAS-hid fat bodies show more lipid droplets. (l) TAG levels measurement in whole larvae (HmlΔ >/+, n = 36, 1.7 ± 0.3 and HmlΔ >UAS hid, n = 36, 3.4 ± 0.7, ***p-value = 0.0005), hemolymph (HmlΔ >/+, n = 60, 0.34 ± 0.08 and HmlΔ >/UAS-hid, n = 66, 0.77 ± 0.16, ***p-value < 0.0001) and fat body (HmlΔ >/+, n = 45, 0.7 ± 0.07 and HmlΔ >/UAS-hid, n = 40, 2.25 ± 0.5, ***p-value < 0.0001). (m–o) tGPH expression in (m,n) fat bodies of feeding L3 larvae from (m) control (HmlΔ >/+) and (n) HmlΔ >/UAS-hid backgrounds shows reduced tGPH expression in HmlΔ >/UAS-hid condition. (o) Quantification of mean tGPH intensities in HmlΔ >/+ (n = 25, 2621 ± 486.2) and HmlΔ >/UAS-hid (n = 25, 1005 ± 196, ***p-value = 0.0001). (p,q) FoxO immunostaining in fat bodies of feeding L3larvae from (p) control (HmlΔ >/+) and (q) HmlΔ</UAS-hid backgrounds. As compared with (p) control, FoxO is nuclear localized in fat bodies of HmlΔ</UAS-hid animals. (r,s) Fat body analysis of FoxO target genes. (r) 4EBP and (s) InR mRNA expression. 4EBP is upregulated in HmlΔ >/UAS-hid condition. Relative fold change is represented and statistical analysis was performed on Ctvalues (4EBP: HmlΔ >/+, n = 60, 2.53 ± 0.91; HmlΔ >/UAS-hid, n = 60, 1.11 ± 0.45; *p-value = 0.0233 and InR; HmlΔ >/+, n = 60, 10.15 ± 0.93; HmlΔ >/UAS-hid, n = 60, 9.99 ± 1.31). (t,u) Fat body analysis of inflammatory pathway target genes. (t) drs and (u) dpt mRNA expression is significantly upregulated in HmlΔ >/UAS-hid condition. Relative fold change is represented and statistical analysis was performed on Ctvalues (drs: HmlΔ >/+, n = 60, 5.40 ± 0.64; HmlΔ >/UAS-hid, n = 60, 2.29 ± 1.28; ***p-value = 0.0002 and dpt: HmlΔ >/+, n = 60, 16.79 ± 1.16; HmlΔ >/UAS-hid, n = 60, 5.78 ± 0.69; ***p-value < 0.0001).

