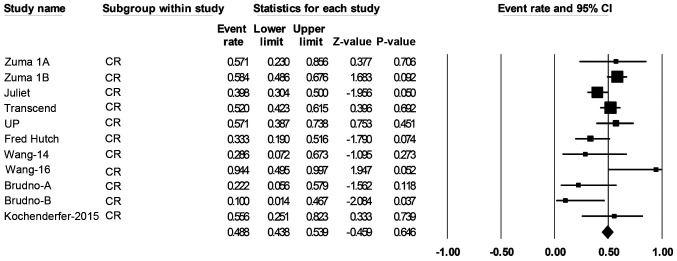
Figure 3.
Forest plot of the CR rate of patients with any B-cell lymphoma. Squares represent the event rates (square size reflects the study-specific statistical weight); horizontal lines represent the 95% CI; and diamonds represent the pooled estimate based on a random-effects model. CR, complete remission; CI, confidence interval.

