
Figure 3. Phylogenomic analysis of orchid WGD events.
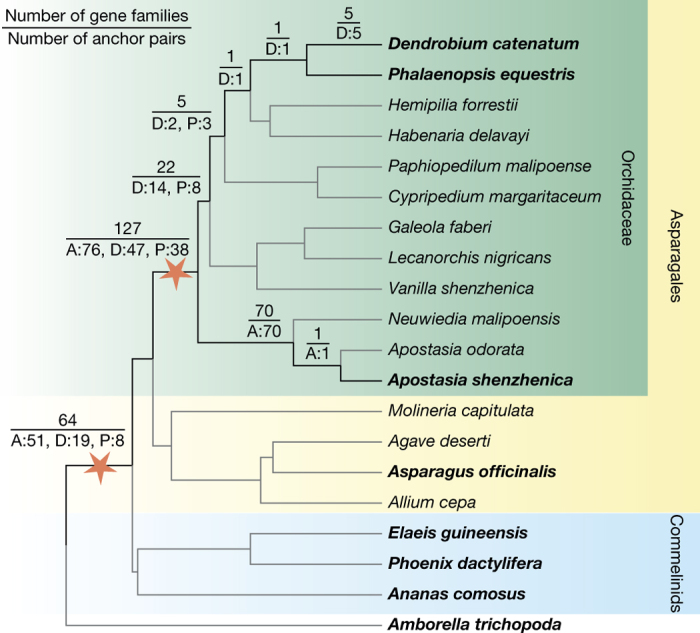
The numbers on the branches of the species tree indicate the number of gene families with one or more anchor pairs from at least one of the three orchids with genomes that coalesced on the respective branch (top), as well as the individual contributions of anchor pairs from the three orchids (bottom; A, A. shenzhenica; D, D. catenatum; P, P. equestris). The two WGD events identified are depicted by stars. Species with published genomes are in bold. All the duplication events have bootstrap values over 80% (see Methods; for results for bootstrap values over 50% see Supplementary Fig. 15).