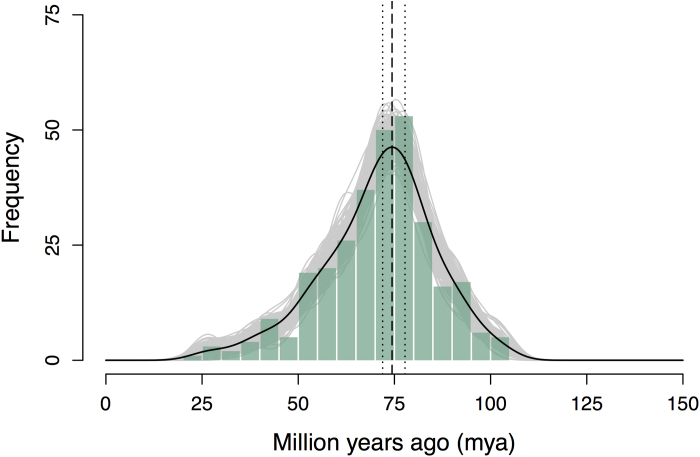
Extended Data Figure 5. Absolute age of the A. shenzhenica WGD event.
Absolute age distribution obtained by phylogenomic dating of A. shenzhenica paralogues. The solid black line represents the KDE of the dated paralogues, and the vertical dashed black line represents its peak at 74 Ma, which was used as the consensus WGD age estimate. The grey lines represent density estimates from 2,500 bootstrap replicates and the vertical black dotted lines represent the corresponding 90% confidence interval for the WGD age estimate, 72–78 Ma (see Methods). The histogram shows the raw distribution of dated paralogues.

