Figure 3:
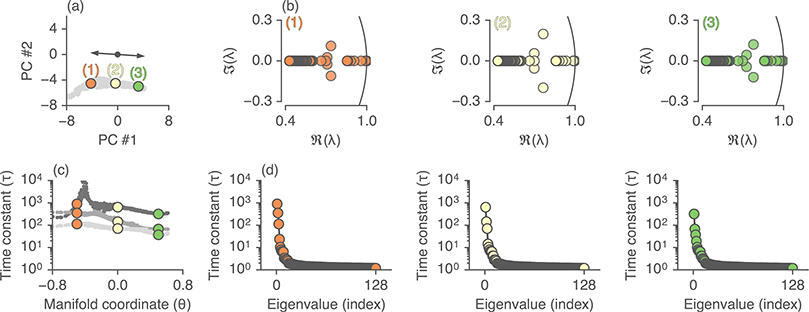
Characterizing the top eigenmodes of each fixed point. (a) Same plot as in Fig. 2c (fixed points are grey), with three example fixed points highlighted. (b) For each of these fixed points, we compute the LSTM Jacobian (see Methods) and show the distribution of eigenvalues (colored circles) in the complex plane (black line is the unit circle). (c-d) The time constants (τ in terms of # of input tokens, see Appendix C) associated with the eigenvalues. (c) The time constant for the top three modes for all fixed points as function of the position along the line attractor (parameterized by a manifold coordinate, θ). (d) All time constants for all eigenvalues associated with the three highlighted fixed points. The top eigenmode across fixed points has a time constant on the order of hundreds to thousands of tokens.

