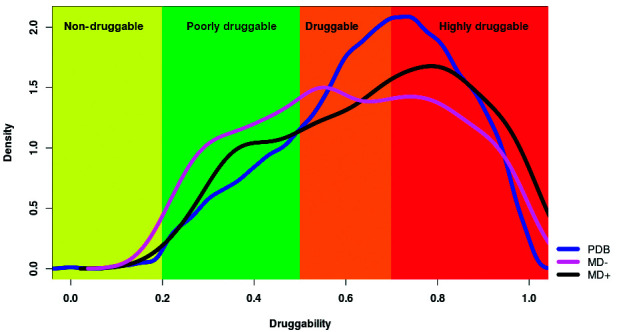
Fig. 2: histogram of the druggability score. All Protein Data Bank (PDB) structures that bind an inhibitor or drug (blue line), only the modeled structures of Bartonella bacilliformis USMLMMB07 from crystallised protein structures without the presence of a drug or inhibitor (pink line) and only modeled structures of B. bacilliformis USM-LMMB07 from protein structures crystallised with a drug or inhibitor (black line) are represented. Considering the distribution of the score (DS) of the pockets of proteins housing a drug-like compound in the DBP, the pockets were classified into four categories: non-druggable (0.0 ≤ DS < 0.2), poorly druggable (0.2 ≤ DS < 0.5), druggable (0.5 ≤ DS < 0.7) and highly druggable (0.7 ≤ DS ≤ 1.0). The curves in Fig. 2 describe a density function in which the curves are fitted to a frequency histogram. It is important to note that in no case the druggability score is less 0 or greater than 1.

