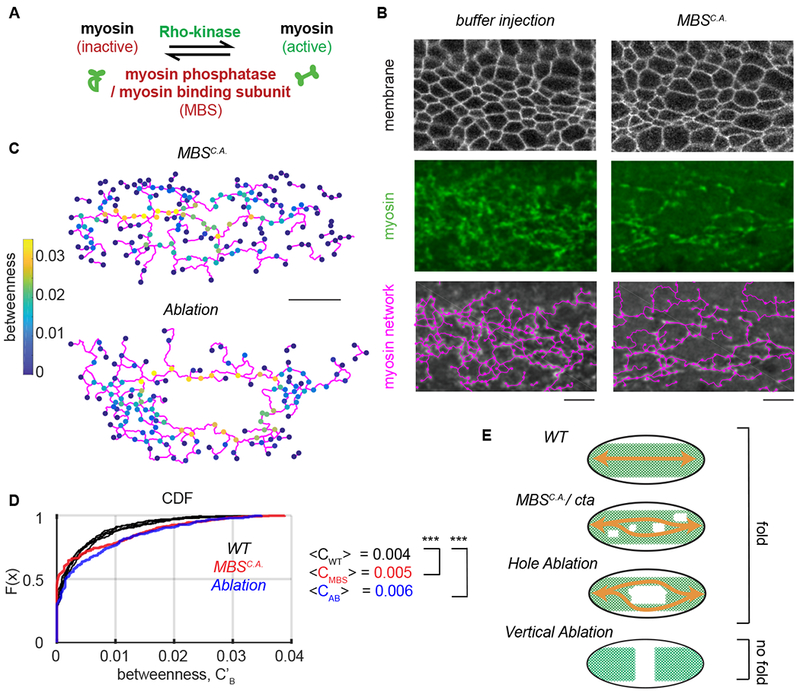
Figure 4. Decreasing network redundancy does not prevent folding.

(A) Cartoon showing myosin regulation. Rho-kinase activates myosin by phosphorylating its regulatory light chain and also by inhibiting myosin phosphatase. Myosin phosphatase/MBS inactivates myosin. (B) Constitutively active MBSN300 (MBSCA) degrades the supracellular myosin network. Images show subapical membrane (Gap43::mCherry, grayscale), Z-projected myosin (Sqh::GFP , green), and the network trace (magenta). (C) The node betweenness for representative embryos at the time of folding where 10 cells were ablated or the embryo was injected with MBSN300 mRNA. (D) The cumulative distribution of function of node betweenness in wild-type embryos (black) or a representative MBSCA–expressing embryo (red) and an embryo where 10 cells were ablated (blue). Note that laser ablation and MBSCA shift the CDF curve down, which indicates a greater proportion of nodes with high betweenness. N = 6 WT embryos, 1678 nodes, Ablation N=2, 343 nodes. p-value comparing WT to AB = 8x10⁻⁵. MBSCA N=2 embryos 401 nodes. p-value comparing WT to MBSCA 3x10⁻⁸ (two-sample KS test). (E) Cartoon showing how redundant connections can continue to link (orange arrows) regions of the tissue after either myosin degradation (MBSCA), in cta mutants or following laser ablation. Vertical laser ablations, however, remove all paths across the embryo. Scale bars (B): 10 μm, (D) 20 μm.
