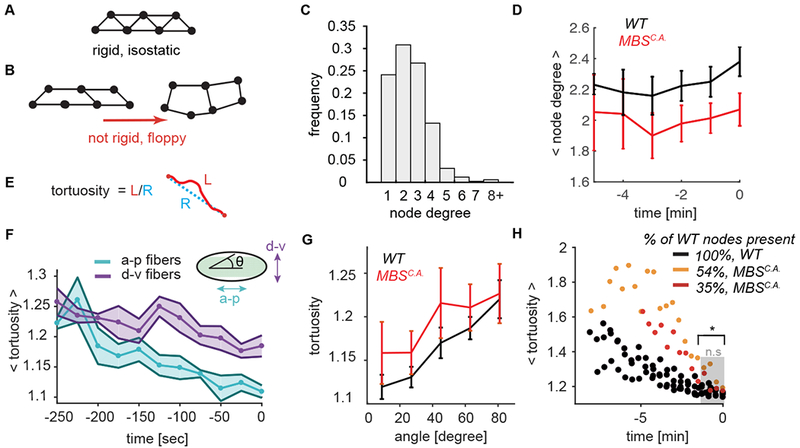
Figure 5. Directional network strain promotes proper folding.

(A-B) Network rigidity is determined by the isostatic limit where the degrees of freedom are balanced by the constraints. The sample network of 7 connected nodes is rigid and cannot be deformed without straining the edges (A). Removing edges from the network in brings it below the isostatic limit and the network can be deformed with no restoring force (B). (C) The degree distribution of the nodes for wild-type networks at the time of folding. The degree of a node degree is defined as the number of edges which connect to it. N=6 embryos, 1361 nodes. (D) Average node degree of both WT and MBSCA is sub-isostatic and does not significantly increase during folding. Plotted is the mean ± s.d. node degree as a function of developmental time up to folding time. (E) Tortuosity is defined as the ratio of the arc length of an edge (L, red) to the distance between the two end points (R, blue). (F) Edges straighten preferentially along the a-p embryonic axis. Plotted bold line and data points show mean tortuosity as a function of time. Shaded region represents ± s.d. N=6 embryos, between 818 (t = − 250) to 1282 (t = 0) edges. Anterior-posterior edges are oriented from 0 – 18 degrees with respect to the midline and dorsal-ventral edges are between 71 – 90 degrees. (G) Degraded myosin networks also exhibit preferential straightening along the a-p axis (angle = 0). N=6 WT embryos, 1972 degrees, N=4 MBSCA embryos, 777 degrees. (H) Folding initiates for both wild-type and MBSCA embryos when the edge connections straighten (i.e. edge tortuosity ~1.2). N=6 embryos (WT), 4 embryos (MBSCA), 1984 edges (WT), 777 edges MBSCA (at t = 0). The distribution between WT and MBSCA is statistically significant up until −100 seconds before folding (t = −100, p = 0.01).
