
Figure 1. Circular representation of the P. fluorescens Pf-5 overall genome structure.
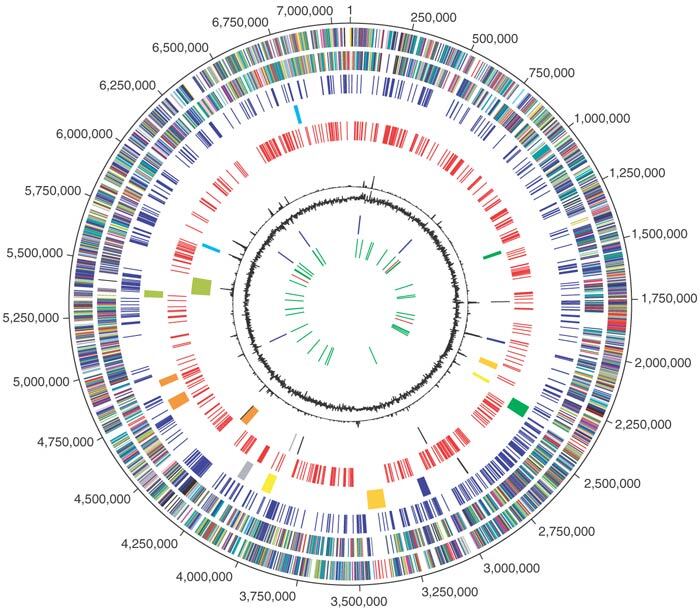
The outer scale designates coordinates in base pairs (bp). The first circle shows predicted coding regions on the plus strand color-coded by role categories: violet, amino acid biosynthesis; light blue, biosynthesis of cofactors, prosthetic groups and carriers; light green, cell envelope; red, cellular processes; brown, central intermediary metabolism; yellow, DNA metabolism; light gray, energy metabolism; magenta, fatty acid and phospholipid metabolism; pink, protein synthesis and fate; orange, purines, pyrimidines, nucleosides and nucleotides; olive, regulatory functions and signal transduction; dark green, transcription; teal, transport and binding proteins; gray, unknown function; salmon, other categories; blue, hypothetical proteins. The second circle shows predicted coding regions on the minus strand color-coded by role categories. The third circle shows the set of 656 P. fluorescens Pf-5 genes that are not conserved in any of the other three Pseudomonas genomes whose sequences have been published (see Fig. 2). The fourth circle shows nine regions encoding secondary metabolism gene clusters coded by color as follows: green, decapeptide biosynthesis; blue, pyoluteorin biosynthesis; gold, polyketide biosynthesis; yellow, pyochelin biosynthesis; gray, pyrrolnitrin biosynthesis; orange, pyoverdine biosynthesis; olive, nonribosomal peptide synthesis; cyan, 2,4-diacetylphloroglucinol synthesis. The fifth circle shows REP repeat elements. The sixth circle shows transposases in black, the predicted PFGI-1 mobile island in olive, and putative phage regions as follows: green, prophage 1; blue, prophage 2; gold, prophage 3; yellow, prophage 4; gray, prophage 5; orange, prophage 6; cyan, prophage 7. The seventh circle shows trinucleotide composition in black. The eighth circle shows percentage G+C in relation to the mean G+C in a 2,000-bp window. The ninth circle shows rRNA genes in blue and the tenth circle shows tRNA genes in green and sRNA genes in red.